Pages

Showing posts with label geogebra. Show all posts

Saturday, April 6, 2013

What time was this photo taken?

As I read through my facebook feed, I was struck with following picture:
Immediately -- shows how much of a dork I am -- I thought "I wonder what time this picture was taken?!"

You see, as the earth rotates around the sun, shadows rotate around the objects that form them. In the northern hemisphere, these shadows rotate clockwise -- which is why clockwise is clockwise. The first clocks ever made were sundials, made by people living in the North, and then clocks were built later.

I figured I should be able to figure out the angle of the shadow of the arch and use it to figure out what time of day the picture was taken.  I could also figure out the date the picture was taken by looking at the length of the shadow. You see, everyday the angle of the sun at a given time changes. Right now, during the spring, the sun is higher in the sky every day at a specific time, which makes shadows shorter. Measure your shadow at 11:00am today and measure it again tomorrow and it will be smaller!

So I found a map of St. Louis, and used Geogebra to figure out the angle of the shadow of the sun, and the length of the shadow.  After about five minutes, I had placed a point on the map that represented where I thought the top of the shadow was, and had drawn a vector from that point to the point that represented the top of the arch. I compared that with the scale of the map, and estimated the length of the shadow to be about 1,000 ft.  After looking on wikipedia, I knew the height of the arch, and a little trig revealed the altitude of the sun to be about 32 degrees.

In a few more minutes I had estimated the angle of the the vector and converted that into a compass heading, which gives me the azimuth of the sun of approximately 111 degrees.  


I knew there is only two times a year where the sun has that exact altitude and azimuth, once in spring and again sometime in the fall -- and I took a chance that this picture was taken on spring break (reasonable enough right?). So I looked up the altitude and azimuth for the sun on the days during spring break:


Since the photo was tagged as uploaded on April 1* I started with that date, and found the following data in the table:
The first column is the time (AM), the second column is the altitude of the sun, and the third column is the azimuth of the sun.  I was disappointed that I didn't see my exact values in the table -- but I didn't expect to either, for two reasons:
  1. I didn't know if this was the correct date -- the picture might have been uploaded that day but taken several days (or even a half a year?!) earlier.
  2. There is some degree of uncertainty in my measurements. As I moved around the point where I thought the top of the shadow was, the angles varied somewhat. To be specific, they varied less than a degree more or less than my values, but that's significant enough to make my answers have to be estimates.

Let me treat each of these reasons separately.  Assuming the picture was actually taken on April 1, and my measurements were slightly off, I would estimate that the picture was taken around 8:34 am local time (I could be off by an hour if the website doesn't account for daylight-savings time, but I'm going to assume they were smart enough for that).

If I don't assume to know the date the picture was taken, and trust my measurements, I would argue that the picture wasn't actually taken on the 1st.  Looking at similar tables for other days, I get much closer altitude/azimuth combinations for a few days later:

 If I had nothing else to go on, I would estimate the date/time of the picture was April 3, 8:33am.

Perhaps the photo takers will provide the true answer in the comments below?

*There was some discrepancy between my wife and I as to when the picture was actually uploaded onto Facebook. It was posted April 5th, "tagged" April 1, but I have reason to doubt the "tagged" date. Only time will tell who wins our little "argument" -- although regardless of who wins, I will probably lose -- right guys?  I love you honey!

Thursday, February 28, 2013

Some Geogebra Hints

Perhaps I should have made
 a real snowman instead
of playing with fake ones

Image by Benice
During our last snow day, I spent a large amount of time (for fear of embarrassment, I will not specify how long...) playing with geogebra. Along the way I learned a handful of tricks that I wanted to write down in one place. So, without further ado, here's an assorted (not random) list of tricks for working with geogebra:
  • Right-click and drag draws a box and zooms in on that box
  • Ctrl-Click and drag grabs the screen and moves it
  • Ctrl-Alt-Delete-Shift-Right-Click and drag infects your computer with millions of geogebra viruses. Don't try it -- the rest of my snow day was spent purging my hard drive and trying to save pictures of my daughters.
  • Entering a point with a semi-colon enters it in polar coordinates
      Ex: (4; 1) puts a point at a radius of 4 and angle of 1 radian (around 57degrees)
      Ex: (4; 30°) puts a point at a radius of 4 and an angle of 30° -- you can find the degree symbol off to the right if you click on the greek letter alpha and find degrees symbol
  • Actually, you can insert a degree symbol while typing by pressing Alt o
  • You can plot a complex number by using the imaginary number i, which you'll have to type using Alt i
  • To plot a function in polar form:
    1. Define your function in f(x) notation
    2. Create a slider to act as the Theta settings (from 0, to 2*pi, by pi/100 is good)
    3. Create a curve with the command:
          curve[f(t)*cos(t), f(t)*sin(t), t, 0, theta]
      To watch someone describe this process watch this video.
  • Actually, you can insert a theta symbol by pressing Alt-t 
  • and a pi symbol while typing by pressing Alt - you guessed it - p. If only microsoft word was that easy.
  • To put a picture into Geogebra is fairly easy, but to describe exactly where it goes, right click on it and go to position tab. Then you can type in the coordinates of the corners of the picture directly, or you can attach these coordinates to sliders so that you can control them dynamically. Often I like to put the picture as a background object, so that other things lie on top of it.

Wednesday, November 21, 2012

Geogebra Activities In My Classroom

I have been spending a lot of time playing around with Geogebra lately -- in my algebra and precalc classes. I love this program because of how easy it is to make functions come alive and allow you to tweak things and see the effect they have. Below I have embedded an example of a geogebra activity I made to help illustrate how transformations change the graph of the basic sine curve.

Sorry, the GeoGebra Applet could not be started. Please make sure that Java 1.5 (or later) is installed and active in your browser (Click here to install Java now) If you can not see it, you might need to update or install Java on your computer. If you can see it, play around with the sliders in the corner -- move them and you will see how the graph adjusts. These are concepts that we delve out in more details of course in class, but this is a tool I use at the beginning of the unit to introduce the idea. It is also something I allowed as an option for my students to make at the end of the unit as an assessment of their knowledge. It takes minimal knowledge to create a graph that moves with sliders -- I can show a student how to do that in about two minutes.  But to add to the graph the other colored lines and line segments that make it so clear what a, b, c, and d do require more advanced programming thinking, and a strong knowledge of the keypoints that are on a graph.

I have made other geogebra activities too -- another of my favorites is to make a guessing game of graphs. By assigning some code to a button, you can have geogebra create a new random graph. So I do that, and then create another controllable graph and have the students try to match the random graph. Here is an example I just had my algebra students playing with the other day:
Sorry, the GeoGebra Applet could not be started. Please make sure that Java 1.5 (or later) is installed and active in your browser (Click here to install Java now)
After a quick demonstration in class, we moved the the computer lab and they spent some time playing around trying to type the equation of the blue line. I could have just given them a worksheet to do, (and seriously thought of it as bad as I was feeling yesterday with a pounding headache) but I preferred this activity instead. It was:

  • A change of pace and scenery
  • Motivating - there is something satisfying in "getting it!" 
  • Self-checking. I believe this is one of the most critical points of an drill-like activity in a math class. If students don't have instant feedback that they are doing something correct, or incorrect, they will quickly develop habits that are hard to undo.
If you are interested in learning more about creating geogebra activities like these, be sure to check out future posts.  

Sunday, November 18, 2012

Are you in radians or degrees? Who cares!?

We're to the point of the year where my precalc students are doing more and more things with radian angle measurements instead of just simply in degrees, so I find myself needing to ask more and more often: "Are you in radian mode or degree mode?" when my students give me an answer from their calculators. You see, if students use their calculator to find a trig value for an angle in degrees, but their calculator is set up in radian mode from making the last graph, then they'll end up reporting an answer that's incorrect. But is that answer too high? Or too low?

It got me thinking, is there some sort of an angle that I could give them where they could incorrectly look up the value in radian mode, and yet by sheer coincidence end up with the same value for degree mode?  That is, are there any angles where:
     

To begin, 0 degrees and 0 radians are the same amount, and so all the trig ratios compute correctly regardless of what mode you are in if the angle is 0.  But for angles greater than 0, a degree is significantly smaller than a radian, and so sine and cosine values will quickly vary significantly depending on what mode you are in.

To convert an angle from one form to the other, I typically use the conversion that 180° = π radians, so to convert from radians, multiply by 180/π.  Roughly speaking this conversion is approximatly 57° per radian, or quite roughly, about 60°. Since they are on different sized scales, there is no other angles (besides zero) where an angle in degrees is the same as in radians. Or are there?

Because of the way angles are defined as rotations around the origin, angles greater than 360° end up being equivalent to (technically "coterminal" to) other angles less than 360°.  For example, 400° is, for all practical trig purposes, identical to 40 degrees, which is 40 degrees further than one complete rotation.  The ratio sin(400) is equivalent to sin(40).  This is true for radian angles too.  A complete rotation is equivalent to 2π or approximately 6.28 radians, so an angle of θ = 7 radians is equal to 7-2π or .7168 rad.

Does this brings up the possibility of some overlapping values perhaps?  32 radians is equivalent to .584 radians (after subtracting 5 full rotations of 2π away) and .584 radians is approximately 33.4 degrees.  That suggests to me that there is probably an angle near here where the two would line up exactly!  But how to find it?

Let's let θ be that angle. I want to find the angle such that  or after a conversion:


After a little rearranging, I get:
     
and
     .
So 32 degrees is basically coterminal with 32 radians. If I want to guarantee that my students don't get their question wrong on the test because of this issue, I should make sure that I ask them what sin(31.97) is. Or, if I want to make sure they don't get any false positives and get a question correct that they don't really know how to do, I should avoid asking such questions on the tests.

This formula can be generalized by allowing any number of rotations around the circle, and presents a handful of different angles which give the same result whether in degrees or radians, by changing the specific number 5 to any integer n:

which gives the first seven angles of:  0, 6.4, 12.8, 19.2, 25.6, 32, 38.4, and 44.8.  With so many angles where their measure and radians and in degrees overlap, it's a small surprise that in all my years of teaching I've never stumbled across one on accident before!  In my examples, I typically come up with angles in degrees, and every six or so degrees there's a correlation. That suggests one time out of every six where I come up with an angle "at random" I ought to have found one!  I wonder how many times I've done it and a student has gotten answers that "kinda matched" what I had in class but were slightly off?  How many times did I just tell them they rounded wrong?

Now the truth is there are even more opportunities where this could happen when using trig functions because they can overlap even within the same units!  For example, sin(75°) = sin(105°). How many more "angle pairings" could this give?  I didn't take the time to find an equation that allows me to calculate them all, because I imagine one of you readers who's interested could probably do it and type it up in the comments, but I did make a graph showing where the angles occur in the first quadrant:
Graph of:
There are twice as many angles, which I probably could have guessed if I had thought about it a little bit. The angles we found earlier are represented by A, C, E, G, I and K, and it looks like nearly halfway in between each of those is another angle.  This suggests that close to one in every three angles I give as an example for calculations of sine ought to give me results that are similar in either degree or radian mode.


Monday, November 12, 2012

Unit Circle Trig Functions


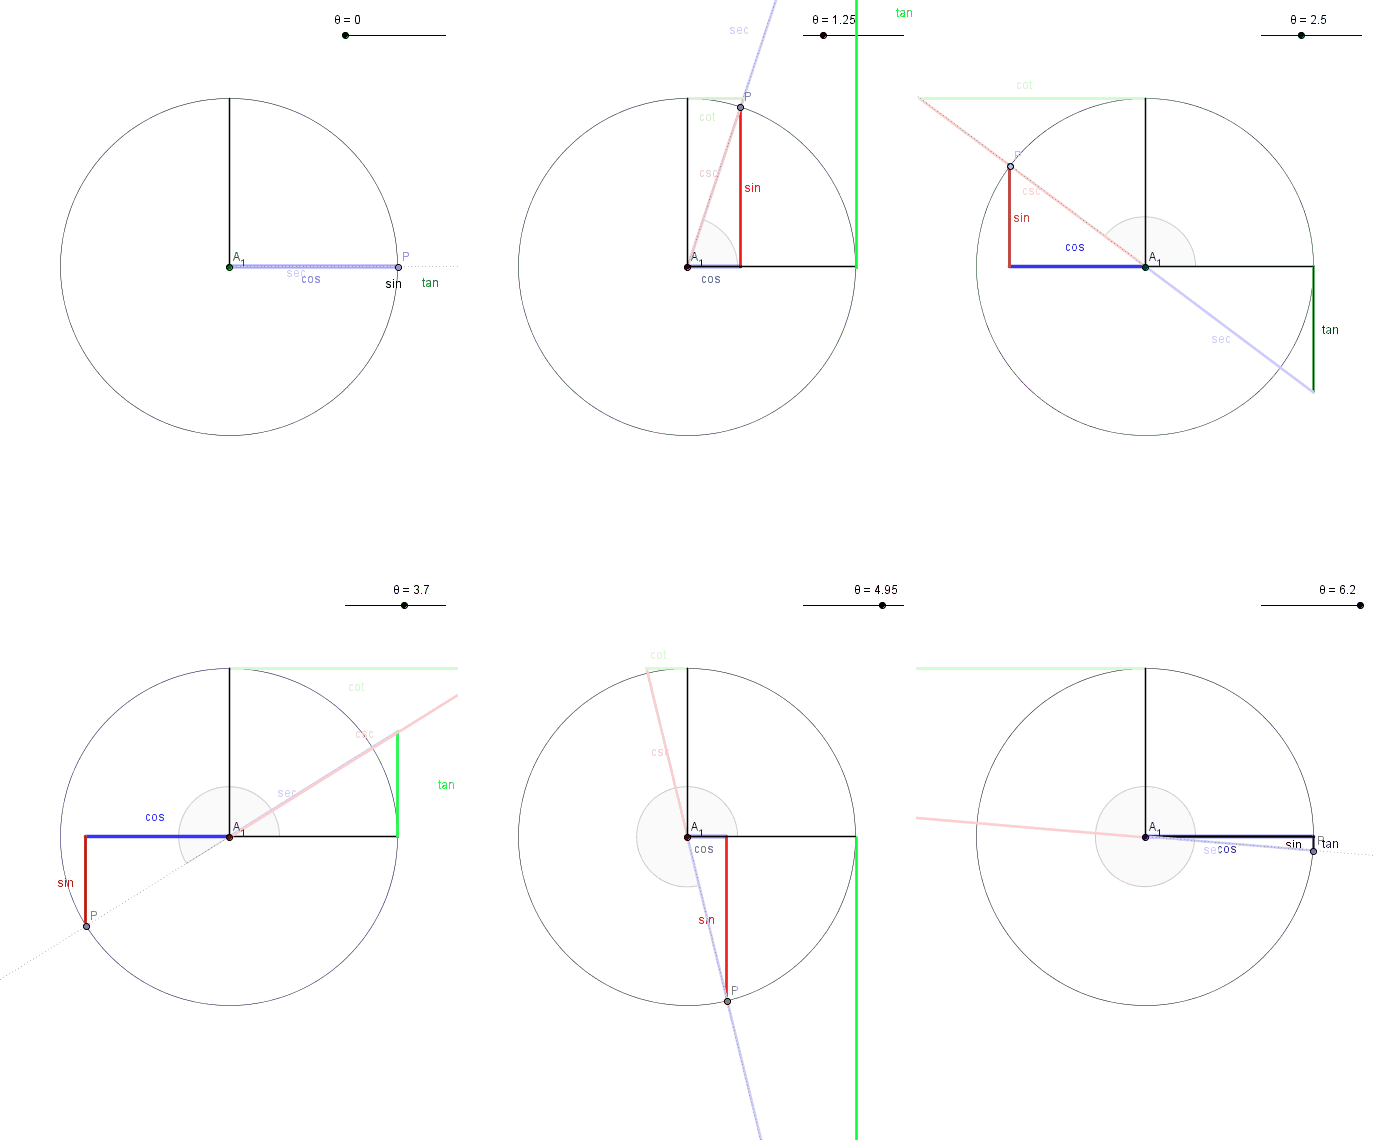
I have been teaching my precalculus students how the trig functions can be defined by using the unit circle. Below is an animated .gif file that shows how each of the six trig functions can be defined using the unit circle:
    The Six Trig Functions on the Unit CircleCreated with Geogebra
    Downloadable image: (952 KB)
    Downloadable Geogebra file: (5 KB)
The angle in the animation ranges from 0 to 6.28 radians, which is 0 to 360 degrees. The circle is a unit circle, which means it has a radius of one. It is centered at (0,0) and the angles are measured in the typical counter-clockwise direction.  Each of the segments is then defined according to the following rules:
  • Sine: The height of P, which is the where the angle intersects the unit circle. Sine ranges from -1 to 1, depending on whether P is below or above the x-axis.  
  • Cosine: The x-coordinate of P, which again ranges from -1 to 1 depending on whether P is to the right or left of the y-axis.
  • Tangent: if you extend the angle out until it means the line x=1, then the tangent will be the segment extending "tangent" to the circle from (1,0) to that intersection. If the angle is in quadrant II or IV, the intersection point is below the x-axis, and so tangent is negative. If the angle is in quadrant II or III, the angle wouldn't intersect the tangent line, unless you extend it backward. Notice it ranges through all values from -inf to +inf, and twice is undefined at 90 degrees and 270 degrees because at those points  the angle never intersects the line x=1 because they are parallel.
  • Secant: if you extend the angle out until it meets the line x=1, then the secant will be the segment cutting through the circle, extending from (0,0) to that intersection. For quadrants II and III, the angle would have to be extended in the opposite direction, which is why secants have negative values there. Secant values are always greater than 1 (or less than -1) because they have to get through the unit circle and out to the line, and the smallest they can ever be is when they at angles 0 and 180 degrees. Like the tangent, secant is undefined for 90 and 270 degrees because the angle is parallel to the line x=1
  • Cotangent: like the tangent, only everything is measured from the complement of 0, or 90 degrees. Extend the line outward until it meets the line tangent to the circle at 90 degrees, or y=1.  If this intersection is on the positive side of the x-axis, cotangent is positive, and negative if on the other side.  
  • Cosecant: like the secant, only the length of the segment extending out to the line y=1. It can have negative values, when the angle is in quadrants III and IV because the angle would have to be extended backward instead
While it takes a day or two of practice for the students to get used to the definitions of the segments, I have found them to be especially useful.  I use these definitions to help estimate trig values, to determine their signs, to develop the idea of graphs of trig functions, and even to prove some identities.  The Pythagorean identities are especially nice to demonstrate here. I always remember 1+tan(x)^2 = sec(x)^2 because they are connected in their definitions, and adding the segment (0,0) to (0,1) creates a 90 degree triangle to which the Pythagorean theorem can be applied.
Related Posts Plugin for WordPress, Blogger...