Pages

Showing posts with label graphing. Show all posts

Wednesday, February 27, 2013

Are you smarter than a calculator?

Lately, I have been noticing how dumb our calculators are. It's become kind of a running theme in my classes, where I've been teaching how to use different graphing tools, and I say several times a week "and remember, you have to be smarter than your calculator" or "you have to help your calculator..."

The calculator doesn't think like humans. God created us--not calculators--in his image, and I believe one aspect of that is the ability we have to reason, to notice patterns, to create, to organize, to see. These are all things that calculators, and in general computers or machines, are all pretty bad at. They are improving, because our minds are helping to generate better and better machinery, but they still don't work like humans.

Perhaps the best example of this is the Captcha messages at the bottom of so many websites. Computers and bots are still horrible at "seeing" things. Most humans can interpret those pictures and type letters or numbers properly, but that relatively simple operation is difficult for most computers. That's because we think about the problems entirely differently.

Likewise, our calculators think about calculations entirely differently than us. We can think algebraically and manipulate symbols, variables, and even numbers in symbolic ways that allows us to simplify problems, or calculate values exactly. Most calculators don't think in that way at all, but are programmed with different algorithms that work with really precise approximations and quick calculations. Even the slowest earliest calculators can do this sort of thing faster than all but the freakest of humans -- but I haven't seen any calculators that are good at playing What's the Word.

Here's a bullet list of items that I've noticed lately:
  • In PreCalc we've been studying complex numbers. One assignment the other day was to calculate i17 which is easy to calculate by recognizing a pattern.  i, i5, i9, i13, and i17 are all equal to the purely imaginary number i, but the calculator spit out -1E-13 + i.  Yes, the -1E-13 is a ridiculously small number, close to zero, but it shouldn't be there AT ALL! What strange algorithm does the calculator use to calculate that instead of just recognizing the pattern like humans?
  • Similarly, some versions of the calculator were not able to convert some of our operations involving complex numbers into exact fraction form -- where as we could. Some calculated approximations (admittedly better approximations than we could find in anything short of five/ten minutes) but several others gave an ERR: data type message instead
  • In Algebra 2, we gave been using the calculator to calculate summations, and the notation for summations is sum(seq(function,VAR,start,end)) and we have been laughing at the fact that even though our functions only have one letter in them, we still need to write that variable again. I understand you could certainly have many variables in a function and then you'd have to specify which one is the index -- but when there's only one, you'd think the calculator would be able to figure that out.
  • In Algebra 1 we've been graphing systems of equations, and numerous stupid calculator quirks have popped up. Though we set the word problems up with sensible variables like N for the number of nickels and D for the number of dimes, when we went to graph things, we had to use the letters X and Y. Again, you could maybe give your calculator the benefit of the doubt because maybe those letters are going to be used for constants (like I do in physics storing 6.67E-11 in for G) but...
  • Then we try to calculate the intersection of two lines and we have to tell it which lines we're interested in and help guide it towards the solution. Seriously?! There's only two lines on the screen! And they're lines! Not curves!  
  • If the intersection isn't on the visible window screen, the calculator won't be able to find it for you -- you need to realize that those lines will intersect above, left, right, etc. of the screen and adjust the window yourselves.
  • And what's with providing the answer as 1.999946 when it's clearly and exactly 2?  The algorithm that calculates the intersection necessarily has limits to its precision, and sometimes those fall short. My students better not ever report an answer of x=1.999946 to me.
  • To be fair, let's pick on non-TI84 calculators -- one of my newfound favorites is the app MyScript Calculator which interprets my handwriting and calculates things for me.  I'll admit, I played with it for a good 30 minutes after downloading it -- only true math nerds play with their calculators right?  But I noticed pretty quickly that it's trig values didn't always calculate properly, which was a bug that their updated version supposedly has fixed. I knew that because I knew the limits of sine and cosine values, and even had several memorized -- and also can estimate relatively well and had ideas of what the answers should be ahead of time.

Friday, February 8, 2013

Graphs of Inequalities

I just finished a unit on inequalities with my Algebra 1 students, and I remember in years past struggling to find a way to include number line graphs in my quizzes, notes, and slide shows.

 Over the years I've amassed a large number of these number line graphs, of different types, and thought I'd throw them up on the blog for the one or two other math teachers who might stumble across this and want them. They are in a PowerPoint format, because I found that working with shapes and lines in PowerPoint was easier than any other program I had.  If you're interested, here's a file containing them.

They are just a series of shape objects, which I alter by adjusting their size or orientation.  Once I have the graph I want, then I select all the objects, copy them, and paste them as a picture, which I can use in PowerPoint or Word.  
One thing I am still looking for is a good source of creating two dimensional graphs. If you know of something, post it in the comments below.

Monday, November 12, 2012

Unit Circle Trig Functions


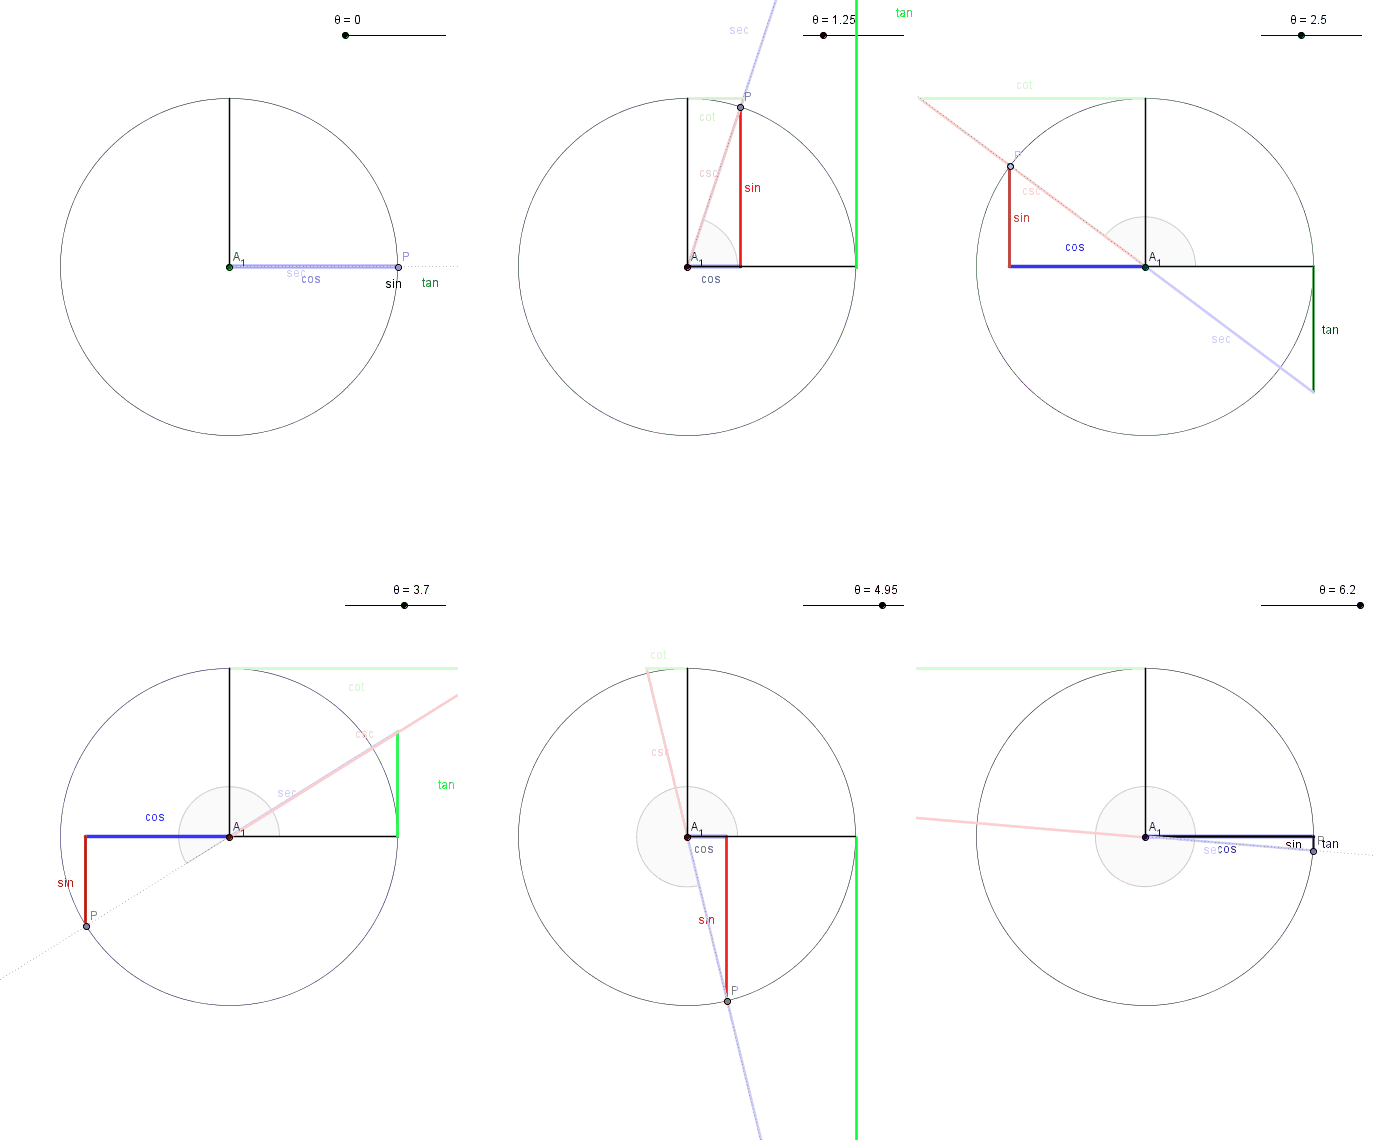
I have been teaching my precalculus students how the trig functions can be defined by using the unit circle. Below is an animated .gif file that shows how each of the six trig functions can be defined using the unit circle:
    The Six Trig Functions on the Unit CircleCreated with Geogebra
    Downloadable image: (952 KB)
    Downloadable Geogebra file: (5 KB)
The angle in the animation ranges from 0 to 6.28 radians, which is 0 to 360 degrees. The circle is a unit circle, which means it has a radius of one. It is centered at (0,0) and the angles are measured in the typical counter-clockwise direction.  Each of the segments is then defined according to the following rules:
  • Sine: The height of P, which is the where the angle intersects the unit circle. Sine ranges from -1 to 1, depending on whether P is below or above the x-axis.  
  • Cosine: The x-coordinate of P, which again ranges from -1 to 1 depending on whether P is to the right or left of the y-axis.
  • Tangent: if you extend the angle out until it means the line x=1, then the tangent will be the segment extending "tangent" to the circle from (1,0) to that intersection. If the angle is in quadrant II or IV, the intersection point is below the x-axis, and so tangent is negative. If the angle is in quadrant II or III, the angle wouldn't intersect the tangent line, unless you extend it backward. Notice it ranges through all values from -inf to +inf, and twice is undefined at 90 degrees and 270 degrees because at those points  the angle never intersects the line x=1 because they are parallel.
  • Secant: if you extend the angle out until it meets the line x=1, then the secant will be the segment cutting through the circle, extending from (0,0) to that intersection. For quadrants II and III, the angle would have to be extended in the opposite direction, which is why secants have negative values there. Secant values are always greater than 1 (or less than -1) because they have to get through the unit circle and out to the line, and the smallest they can ever be is when they at angles 0 and 180 degrees. Like the tangent, secant is undefined for 90 and 270 degrees because the angle is parallel to the line x=1
  • Cotangent: like the tangent, only everything is measured from the complement of 0, or 90 degrees. Extend the line outward until it meets the line tangent to the circle at 90 degrees, or y=1.  If this intersection is on the positive side of the x-axis, cotangent is positive, and negative if on the other side.  
  • Cosecant: like the secant, only the length of the segment extending out to the line y=1. It can have negative values, when the angle is in quadrants III and IV because the angle would have to be extended backward instead
While it takes a day or two of practice for the students to get used to the definitions of the segments, I have found them to be especially useful.  I use these definitions to help estimate trig values, to determine their signs, to develop the idea of graphs of trig functions, and even to prove some identities.  The Pythagorean identities are especially nice to demonstrate here. I always remember 1+tan(x)^2 = sec(x)^2 because they are connected in their definitions, and adding the segment (0,0) to (0,1) creates a 90 degree triangle to which the Pythagorean theorem can be applied.

Using Excel to Make X-Y Grids for Graphing

I've seen a lot of bad looking xy grids in my days, looking at other teachers worksheets and tests, and I wanted to show what I use and make it available. I create a scatter plot in Excel, hide the points that created it, and change the window by adjusting the x and y axis. Over the years, I have refined the look, and created a huge bank of different sized graphs, similar to the one below:
Sample Graph, created in Excel
Downloadable Excel File 
Anytime I need a graph for a worksheet, quiz, or test, I open up this file.  (I do that easily by having it pinned on the start menu). I see twenty or so graphs immediately available, and if any one of those works, I'll just copy and paste it into the quiz. If I don't see one that I like, I'll make a copy of one of them and paste it into excel (this way my library of graphs always grows) and I'll change the x-axis and y-axis to fit what I might need.  To do this, right click on the x-axis, or y-axis, and go to "Format Axis" near the bottom.  The following window will come up, where you'll want to make some changes:
The adjustments in red are my most common changes -- this window is what comes up when I clicked on the y-axis in my sample graph above.  By adjusting the maximum or minimum values (in the red circle) the graph can display more or less along the y-axis. In my graphs, the major unit is how often the numbers on the side will appear, and the minor unit is how often the dashed lines appear.

Adjusting the axis labels to appear on the low side (see orange circle) is a nice touch, which is why the numbers don't occur on the y-axis directly, but off to the side.  This keeps them out of the way, and a little neater in my opinion.

The line style page (see yellow circle) is how you can adjust how the axis itself appears. I decided to make it stand out against all the other lines by making it a little thicker. If you right click on the dotted lines (called major gridlines) you can also adjust their look.  I find that making them dashed and thinner makes them useful, but not overwhelming when printed.

I typically copy and paste these graphs directly into Word, but sometimes I want them to be pasted as pictures, instead of as editable graphs, embedded in the word file. To do this, instead of pasting in the usual way, Paste Special (I do this by pressing Alt E, S because I memorized that keyboard shortcut from older versions of Word) and then choose to paste it as a picture.
Related Posts Plugin for WordPress, Blogger...