Pages

Wednesday, November 14, 2012

Chutes and Ladders (or Tangents and Cotangents)

Chutes and Ladders - a game for ages 4 and up
Tangents and Cotangents - a game for ages 16 and up
Last week I was playing Chutes and Ladders with my daughter (well, I was playing and she was arguing with me about why I kept moving my piece three spaces forward and didn't just put it on a space that had a three in the number, like 3, 13, 23, etc like she must have thought were the rules) and I made the amazingly smart observation that there were six spaces in the spinner, and there were six basic trig functions. Before long I had gotten board and wanted to find ways to add strategy to the game, and found that at times it was more beneficial to go backwards several spaces instead of forward, if by doing so I could avoid a chute or land on a ladder.

It wasn't long before I had decided upon a few rules, and come up with a game we could play in precalculus, which I decided to call "Tangents and Cotangents".  I thought the name was a nerdy way of describing Chutes and ladders, because the graph of cotangents is always decreasing like chutes, and the graphs of tangents are always increasing like ladders.

I brought the game to school, and described the following rules to the students:

  • Students (in teams) would answer estimation questions like sin(25) or tan(258).  (NO CALCULATORS ALLOWED!) Each trig function was worth a different amount of points. If the students estimated within 10% of the correct value, they moved forward that many spaces. If not, the other teams would be able to steal the points if they had estimated correctly -- so everyone was interested in every question. The points were defined as follows:
    • sine = 1pt
    • cosine = 2pt
    • tangent = 3pt
    • secant = 4pt
    • cotangent = 5pt
    • cosecant = 6pt
  • If the team guessed the value within 10%, but had the opposite sign, they went backwards that many spaces. While this might seem like an annoying penalty, eventually one of the teams caught on that it could be used their advantage to land on the coveted 28 square, and it wasn't long before teams were "purposely" getting the sign wrong to their advantage. I didn't mind, because it made them think about and practice the signs of the values too -- part of my objective for the day.
  • Once per game, I allowed the teams to choose what point value they wanted to play for -- typically they were chosen at random like normally in the game. This added an element of strategy for the students who would wait to the opportune time to try to hit a big ladder. I think I would change this rule next time to reward REALLY close guesses (say, within 1%) with an additional free choice.  
  • Occasionally we would play a question that was available for all four teams. Any team that guessed within range was awarded the points (forward or backwards as necessary)
In order to help facilitate the random choosing of the game, I created an excel file that gave me a random trig estimation question every time I pressed F9, and then displayed the answer and the acceptable range of values when I pressed F9 again. When students chose a particular point value, I had to press F9 repeatedly until the appropriate value came up -- for instance, when one group wanted a 4 point question in order to land on space 80 for the win, I had to press F9 over and over again until a secant question came up. You may download this excel file here, and you can read about the underlying workings of it at my post here.  For more on estimating trig functions, I suggest you read on the unit circle definitions of trig functions.

Monday, November 12, 2012

Unit Circle Trig Functions


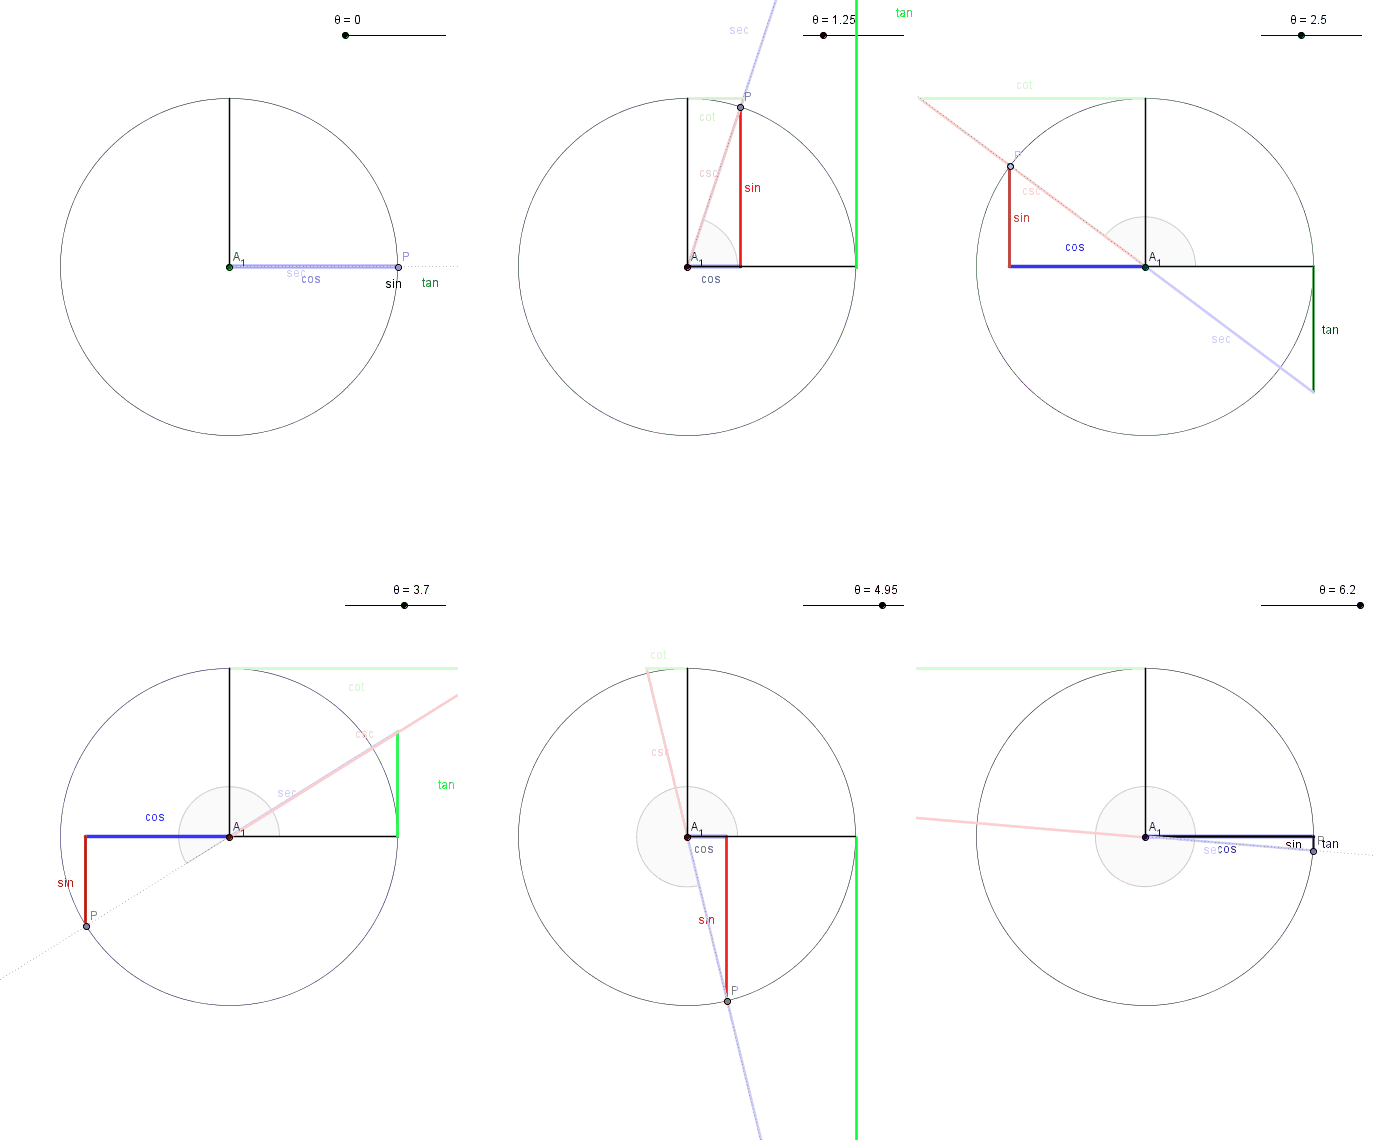
I have been teaching my precalculus students how the trig functions can be defined by using the unit circle. Below is an animated .gif file that shows how each of the six trig functions can be defined using the unit circle:
    The Six Trig Functions on the Unit CircleCreated with Geogebra
    Downloadable image: (952 KB)
    Downloadable Geogebra file: (5 KB)
The angle in the animation ranges from 0 to 6.28 radians, which is 0 to 360 degrees. The circle is a unit circle, which means it has a radius of one. It is centered at (0,0) and the angles are measured in the typical counter-clockwise direction.  Each of the segments is then defined according to the following rules:
  • Sine: The height of P, which is the where the angle intersects the unit circle. Sine ranges from -1 to 1, depending on whether P is below or above the x-axis.  
  • Cosine: The x-coordinate of P, which again ranges from -1 to 1 depending on whether P is to the right or left of the y-axis.
  • Tangent: if you extend the angle out until it means the line x=1, then the tangent will be the segment extending "tangent" to the circle from (1,0) to that intersection. If the angle is in quadrant II or IV, the intersection point is below the x-axis, and so tangent is negative. If the angle is in quadrant II or III, the angle wouldn't intersect the tangent line, unless you extend it backward. Notice it ranges through all values from -inf to +inf, and twice is undefined at 90 degrees and 270 degrees because at those points  the angle never intersects the line x=1 because they are parallel.
  • Secant: if you extend the angle out until it meets the line x=1, then the secant will be the segment cutting through the circle, extending from (0,0) to that intersection. For quadrants II and III, the angle would have to be extended in the opposite direction, which is why secants have negative values there. Secant values are always greater than 1 (or less than -1) because they have to get through the unit circle and out to the line, and the smallest they can ever be is when they at angles 0 and 180 degrees. Like the tangent, secant is undefined for 90 and 270 degrees because the angle is parallel to the line x=1
  • Cotangent: like the tangent, only everything is measured from the complement of 0, or 90 degrees. Extend the line outward until it meets the line tangent to the circle at 90 degrees, or y=1.  If this intersection is on the positive side of the x-axis, cotangent is positive, and negative if on the other side.  
  • Cosecant: like the secant, only the length of the segment extending out to the line y=1. It can have negative values, when the angle is in quadrants III and IV because the angle would have to be extended backward instead
While it takes a day or two of practice for the students to get used to the definitions of the segments, I have found them to be especially useful.  I use these definitions to help estimate trig values, to determine their signs, to develop the idea of graphs of trig functions, and even to prove some identities.  The Pythagorean identities are especially nice to demonstrate here. I always remember 1+tan(x)^2 = sec(x)^2 because they are connected in their definitions, and adding the segment (0,0) to (0,1) creates a 90 degree triangle to which the Pythagorean theorem can be applied.

Using Excel to Make X-Y Grids for Graphing

I've seen a lot of bad looking xy grids in my days, looking at other teachers worksheets and tests, and I wanted to show what I use and make it available. I create a scatter plot in Excel, hide the points that created it, and change the window by adjusting the x and y axis. Over the years, I have refined the look, and created a huge bank of different sized graphs, similar to the one below:
Sample Graph, created in Excel
Downloadable Excel File 
Anytime I need a graph for a worksheet, quiz, or test, I open up this file.  (I do that easily by having it pinned on the start menu). I see twenty or so graphs immediately available, and if any one of those works, I'll just copy and paste it into the quiz. If I don't see one that I like, I'll make a copy of one of them and paste it into excel (this way my library of graphs always grows) and I'll change the x-axis and y-axis to fit what I might need.  To do this, right click on the x-axis, or y-axis, and go to "Format Axis" near the bottom.  The following window will come up, where you'll want to make some changes:
The adjustments in red are my most common changes -- this window is what comes up when I clicked on the y-axis in my sample graph above.  By adjusting the maximum or minimum values (in the red circle) the graph can display more or less along the y-axis. In my graphs, the major unit is how often the numbers on the side will appear, and the minor unit is how often the dashed lines appear.

Adjusting the axis labels to appear on the low side (see orange circle) is a nice touch, which is why the numbers don't occur on the y-axis directly, but off to the side.  This keeps them out of the way, and a little neater in my opinion.

The line style page (see yellow circle) is how you can adjust how the axis itself appears. I decided to make it stand out against all the other lines by making it a little thicker. If you right click on the dotted lines (called major gridlines) you can also adjust their look.  I find that making them dashed and thinner makes them useful, but not overwhelming when printed.

I typically copy and paste these graphs directly into Word, but sometimes I want them to be pasted as pictures, instead of as editable graphs, embedded in the word file. To do this, instead of pasting in the usual way, Paste Special (I do this by pressing Alt E, S because I memorized that keyboard shortcut from older versions of Word) and then choose to paste it as a picture.

Saturday, November 10, 2012

Quick Random Review Questions with Excel

One of my current uses of Microsoft Excel in the classroom is to quickly provide review questions for my students. I've used it in my Algebra classes to practice multiplications quickly by playing Around The World.
Around the World - Multiplication
   
Download this Example
In order to set this file up, I used just one function - the randbetween() function. In B1 I entered the formula "=randbetween(1, 12)" which gives you an integer ("nice number") between 1 and 12.  I entered the same thing in D1 and now Excel gives me a random multiplication problem for the students to figure out.  The key is every time you press F9, it gives you another random problem.  This is because F9 "recalculates" each cell, which in this file effectively re-rolls the dice.

Of course it's customizable by altering the numbers in the function. Sometimes I'll challenge them and go up above 12. Or I'll throw negative numbers into the mix. Of if too many "easy" ones have been coming up, I'll make at least one of them range from 6 to 12 instead of 1 to 12. The possibilities are nearly endless.

A more advanced function, coupled with this idea, can make this tool all the more interesting.  Suppose you'd like to throw up different kinds of questions -- additions, subtractions, multiplications and/or divisions? If you'd like excel to choose one of them at random, you can use the choose function:
   = choose( #,   "+",    "-",    "x",    "/")
This function will either give you a +, -, x, or / sign, depending on what # is.  If you type a specific number, say 3, then it will always give you the third choice, in this case "x".  If you instead type "randbetween(1,4)" in place of x, then it will randomly pick a number between 1 and 4, which will determine which operation to use. This effectively chooses a random operation of the four.  All together it would look like this:
   = choose(randbetween(1,4),  "+",  "-",  "x",  "/")
The "" symbols around each of those operations are required, or excel will get confused and give you an error.

I typically don't display the answers, because I can calculate them as fast (or faster!) than the students and know if they are right or wrong, but if you wanted you could create a formula that calculates them for you.  If you have the same operation all the time, this is easy -- just type "=b1*d1" somewhere.  It is a little trickier if you have excel randomly choosing operations, and requires a slight tweak of the choose function above.
  1. In a1, type "=randbetween(1,4)"
  2. Change the choose function to read: "=choose(A1, "+", "-", "x", "/")
  3. In a box where you want the answer displayed, type "=choose(A1, b1+d1, b1-d1, b1*b2, b1/b2)"

This is required because if you don't have a common cell (a1) to refer to when choosing the operation, you might have Excel choose to display a + sign, but display the answer to a subtraction problem, because a different random number was chosen in each cell. In this example, with four operations, it would be inconsistent 75% of the time, but by referring to A1, both the question and answer will always be the same.

By the way, if you want to stack the deck towards certain operations, you can have a choose function that looks like this:
      = choose(randbetween(1,8) , "+", "+", "-", "-", "*", "*", "*", "*")
which would give you twice as many multiplication problems then adding or subtracting.

Also, I don't actually have them practice division problems like this because most of the time they would be decimals or fractions. If you want them to have divisible problems all the time, alter this template to show the answer to the multiplication problem.  Then show the answer and only one of the factors. Hide the other by making the column super thin, or making the font color white. This will guarantee that the divisions are always nice.

If you have this file available as a shortcut on your desktop, it is super quick to put up at the end of class if you have a few minutes available before the bell.

Saturday, October 20, 2012

Character Qualities for Devotions

In many of past years of teaching, I've had the responsibility of leading my first hour students in devotions. Most of the time I have seen this as a great worry -- one more thing for me to plan for. Admittedly, this shouldn't be a huge problem, except for the fact that I have not really developed the discipline of personal devotions or Bible study in my own life, and so I don't have much to go from. That struggle is a-whole-'nother post which is probably too personal for me to write about some other day.

Operational Definitions of Character Qualities
This year I found something I have enjoyed very much using for my classroom devotions.  My wife brought home from her M.O.P.S. meeting a handout of Operational Definitions of Character Qualities. I don't know the original source -- a quick search showed them related the Duggars, or from Bill Gothard.

This sheet contains 49 characteristics, an antonym for each, and a definition which helps unpack the meaning behind the word.  Then a bible verse is suggested which places some context to the word. The picture provides just a snippet of four of the words -- including the word Love. The antonym provided for love is "selfishness" which condemns me a lot. Many times instead of showing love to my family, I want to do my own thing. Especially when I first come home from work.

Lately, we've been taking a few minutes to digest a word -- typically by trying to describe it at first, then list several opposites, and ending with reading the passage associated with the word. This has lead to several fruitful discussions with students regarding many related topics. One day we talked about how we need to choose to love some people because it doesn't come naturally at times -- and is that ok? The word of the day was honesty -- and the student felt they were being dishonest perhaps in loving someone when they were angry or frustrated with them. I was able to share that many times, in marriage for instance, we need to start by showing love, and then the feelings follow. Actions drive feelings, as opposed to deriving from them.

Anyway, I thought perhaps others could benefit from this list of words and learn from them too. If you decide to look at them, share any revelations or surprises you find in the comments below!

Friday, October 19, 2012

Notes and Links from MANS Conference

Image of of my blog, made in Tagxedo.
The past few days I have been attending a teacher's conference, and this post is an assorted list of links and brief descriptions of some of the things I heard about and might want to look into more deeply:

Scoop.It: A networking and bookmarking tool -- seemed like Pinterest for teachers.
Twitter: I already have an account and you can follow me @rockyroer
iEar: list of teacher reviewed apps for education.

Storybird: Website for making story books, which was very easy to pull in beautiful artwork
Fodey: Website for making student written news articles appear newsarticle-y.
Wordle: Create artwork from chunks of text, by frequency of word
Tagxedo: Similar to wordle, but you can use different shapes of words.
Voki: a website that can read text outloud, in many different voices, and languages.

Lulu: A self-publisher. Send your student work here and they can print off their own books and have it shipped to their house. Others can buy it too if you make it public.  Imagine someone in another state or country wanting a copy of your short stories or poems?  Or a grandparent who wants something special for Christmas?
Cafepress: Create your own ... T shirt? Coffee Mug? Purse? You name it! Imagine making your first graders painting off your fridge and keeping it forever on a plate?

Games:
   Lure of the Labrynth: A game that teaches algebra skills -- apparently quite involved
   Isle of Tune: A web game where users make cartoon maps, but as cars travel around and pass trees, houses, etc, music is played. Very impressive version that plays Don't Stop Believing
   iCivics: Many different games related to civics, government, and economics.

Blue Elephants and Polynomial Equations


The other day in my precalculus class I used a series of jokes to make a point. We were studying polynomials, and how to solve polynomial equations such as:
Polynomial Equation:
The basic technique for solving a polynomial equation is to move everything to one side of the equals sign, and then search for the roots -- or x-intercepts of whatever is left.  This roots searching was something we had spent about a week practicing and refining, but hadn't yet discussed why one would bother looking for roots.  This example would lead to the equation  which has the graph: 
y=3x^3+6x^2+8x+6 has a root at x=-1.18
Image made in Geogebra
Since this equation has only one x-intercept, it has one solution, which is approximately -1.18.  (Yes, it also has two complex roots, but that's more than we need to discuss today).

One of the major reasons for finding roots is to solve these types of equations, but this root finding skill can also be useful in solving different types of equations. For instance, we learned how to solve "rational equations" which are polynomial equations with fractions involved: 
Rational Equation:
The basic strategy for this type of equation is to multiply by the denominators, which will eliminate the fractions, converting this ugly equation into a polynomial equation, which we can then find roots of.

We also learned how to solve "radical equations" using a similiar "convert and tackle" mentality:
Radical Equation:
The technique for these is to eliminate the radical by getting it alone one one side, and then squaring both sides. This will give you a polynomial equation which you can find the roots of.

This lesson reminded me of the blue elephant jokes I learned as a child, and shared with my students:

Teacher: How do you kill an elephant:
Student: I don't know
Teacher: With an elephant gun.  
Teacher: How do you kill a blue elephant?
Student: I don't know?
Teacher: With a blue elephant gun!
Teacher: How do you kill a pink elephant?
Student: With a pink elephant gun?
Teacher: No! You hold his trunk till he turns blue, and shoot him with a blue elephant gun.
Teacher: How do you kill a purple elephant?
Student: Hold his trunk till he...
Teacher: No! You first paint him pink, then hold his trunk till he turns blue and shoot him with a blue elephant gun. How do you kill a green elephant?
Student: Paint him ...?
Teacher: You fool! There's no such thing as a green elephant!

Students caught on pretty quickly to the absurdity of the jokes, but also saw the connection between killing blue elephants, and the equations we were slaying. One hour in particular enjoyed the metaphor and now calls all polynomial equations "blue elephants".  
Related Posts Plugin for WordPress, Blogger...