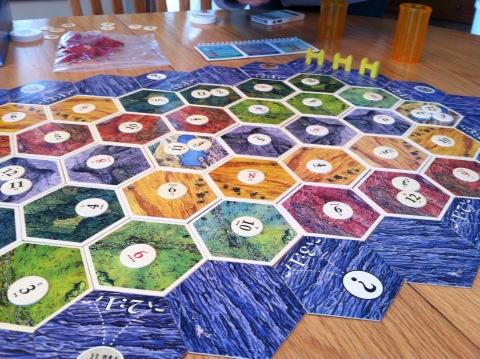
Our family loves playing Settler's of Catan. Settler's is board game where you must collect resources (wood, wheat, ore, sheep, and brick) in order to build different things (settlements, roads, cities, knights, ships, etc). The resources you collect each turn depends on how much you have built, and where you have built, and the roll of a dice. If you have built next to certain numbered tiles, then you collect those resources when that number is rolled. As you expand, you touch more numbered tiles and collect greater resources.
Mathematically, this means that the number of resources you collect as the game progresses follows an exponential curve, shown to the below. This is a very common curve for growth, and is especially common in places where how much you grow depends on how much you have. Other common places of exponential growth is financial (interest on money grows depending on how much you have invested) and populations (the more people or animals there are, the more they are making babies).
This exponential nature of the game suggests a very important strategy -- which I like to think of as "steepen the curve". The most important thing that you can do in the game is to increase your chances at collecting resources. Every time you do this, you increase the number of resources you're likely to obtain until your next turn, making your next turn even more powerful than your last. Even though there may be quicker ways to earn points, like making a longer road for instance, do whatever it takes to get another settlement, or another city.
Setting up the game, you start off with a settlement and a city, which allows you to touch or collect resources from up to six different numbered hexes. To begin, you need to build a road and a settlement faster than anyone else. This requires two wood, two brick, a wheat and a sheep. If you can collect these before any of your opponents, you have significantly increased your odds of winning. While I have not been nerdy enough to record these statistics during all the games I've played, I feel confident saying that more than half the times I've played and managed to build the first settlement, I've won.
To illustrate why, let me show a graph. On the x axis is the number of turns in a game, and on the y-axis I have graphed "Resource Cards Obtained". To begin, your six (or so) tiles probably have a collective rate of return of somewhere around 2/3 of a card per roll of the dice (more about this in a different post). Starting out with 3 cards, this puts you and your opponents on the line y = 2/3x + 3. This suggests it would take you about 6 dice rolls before you'll have enough cards (actually 7, one more than enough) to buy a settlement. That is point A on the graph. If you are able to buy a new settlement, this ought to increase your chances at collecting resources -- perhaps to around an average of 1 card per roll now. This is indicated by the steeper line in the graph. Now you'll gain more resources, and reach the next pivotal point faster than your opponents.
The next chance you have to steepen your curve, do it. This will require either building another city (two wheat and three ore) or a settlement (two wood, two brick, a wheat and a sheep). Either way, on average it will take another six rolls to obtain this. I'll take a moment to illustrate the strategy of building a settlement/city as soon as I can. My assumption is that on average each new settlement will increase the slope of my resource gaining line by 1/3 of a card per dice roll. On average it will take 5 to 6 cards (granted, they have to be the right cards, but that's what trading is for) to earn a chance to build. Within 6 more rolls I can probably build again, and then it only takes about 4 to build again, and then only about 3. With each successive build, the number of rolls before I can build again goes down on average. This produces the steepening set of lines drawn to the right. Taken as a whole, this looks very similar to the exponential curve shown earlier -- even though it's a series of lines.
Why is this strategy so important? Let me illustrate with a simple choice, early on in the game. There is a rule that says you must build your first settlement two roads away. Suppose instead you decide to take time to build three roads away -- figuring it will help you to branch out a little first. This will likely take an additional 3 rolls at the beginning of the game, because you only average 2 cards per 3 rolls early on. This seemingly insignificant choice actually puts you significantly behind. If you now change strategies and try to build as aggressively as your opponent did from the get-go, you'll find yourself just falling further and further behind. In this final graph - the red curve shows aggressive building from the beginning and the black curve growth delayed by just one choice - waiting to build a settlement after an extra road. Notice how the two curves are getting further and further spread out as the game progresses.
Now I'll admit this is a simplified graph - and there are times where building farther away might be advantageous. For example, maybe building in one location over another allows you to create a much steeper rate of return than another location -- but in the grand scheme of things, it would have to be perhaps twice as good to make up for the extra turn it takes to build there. If it only causes you to touch a 6 instead of 5 -- it's probably not going to catch up with someone who has already built and started walking along the red curve.
It also suggests making efforts to obtain the important cards that cause you to build quickly. Wood and bricks (to make roads and settlements) are crucial at the beginning -- the others can be obtained in time, which you'll have if you are able to build a settlement first and always be on a steeper curve than your opponents.
A blog about math, physics, and teaching math and physics. With occasional other entries popping in from time to time.
Showing posts with label probability. Show all posts
Thursday, January 3, 2013
Wednesday, January 2, 2013
Expected Value and Settlers of Catan
Settlers of Catan is a board game my family likes to play, where you obtain resource cards based on the roll of the dice, and what terrain hexes you have built settlements and cities next to. The board, shown below
shows how each hex is assigned a different number.
Suppose in the course of the game you have obtained a settlement on the corner of a 6, 9, 10 spot. How does that compare to say, a city (which collects double) on a 2, 3, 6 spot?
| Dice Rolling Combinations: Image by BestCase |
Because you are rolling two dice, certain numbers are more likely to come up than others. For instance, 7's are more likely than 10's because there are more ways that you can roll a 7 than rolling a 10. In the image to the right, you can see that there are six ways to get a 7 but only 3 ways to get a 10. Over the course of time, more sevens will usually come up than 10's. Settler's does a nice job of helping you see this by placing dots on the number tiles. Each dot represents the number of ways of obtaining that number. For instance, the 6-tiles each have five dots on them because there are five ways of rolling them.
Probability, with dice and cards for instance, is calculated by dividing the number of ways of obtaining a desired outcome by total number of ways possible. So for rolling a 10, the probability is 3 out of 36, or about 9 percent.
Expected value is useful when different outcomes have different payouts. For instance, in the course of the game you might find yourself receiving five different cards every time a 4 is rolled, or three different cards whenever a 8 is rolled. 8's are rolled more often, but 4's receive more when they are rolled. We would say both of these have the same expected value. Expected value is calculated by multiplying the probability of an outcome by its payout. Rolling a 4 has a probability of 3/36 * 5 cards is an expected value of 15/36. Rolling an 8 has a probability of 5/36 * 3 cards gives an expected value of 15/36.
At the start of the game, I had a settlement on a 6, 9, and 10, and I had a city on 2, 3, and 6. Settlements receive one card each, and cities two. So to begin, I would calculate my expected value as:
6: 5/36 * 1 = 5
9: 4/36 * 1 = 4
10: 3/36 * 1 = 3
2: 1/36 * 2 = 2
3: 2/36 * 2 = 4
6: 5/36 * 2 = 10
Total: 27/36
This suggests if I rolled the dice 36 times, I should expect 27 cards when all is done. Reduced, this suggests I will earn cards at an average rate of 3/4 of a card per roll of the dice. Some days I'll gain more than that but others I'll gain nothing.
As the game progresses, I'll have more settlements and cities, and my expected number of cards each roll of the dice should increase. Tomorrow's post will expand on this, and show the importance of increasing this expected value as quickly as possible.
Tuesday, January 1, 2013
New Years Baby
My father in law is a New Years baby. In fact -- he is THE new years baby for his hometown -- the first child born in 19591955. I think he has a bronze-plated baby bootie to commemorate the occasion.
I was wondering, as I always do, "What are the chances?"
Unfortunately, this question is hard to answer because it is kind of vague, so I'll try to tackle some of the different directions this question could be answered.
First, what are the chances of having a baby born on New Years? Assuming all days are created equally, it would seem that being born on New Years would be a 1/365 chance. However, all days are not created equally. Some days are notoriously popular for delivering babies, and others particularily avoided. Christmas for instance, has very few babies born on it, but the days just prior and just after have a slightly higher likelihood. New Years is another one of those days. Of course, many pregnancies are planned and the most popular times to have children is July Aug and September, with January being one of the leas popular months to have children. This is illustrated beautifully in the info-graphic to the right.
Assuming you want to try to have the New Years Baby -- what are your chances? This is a sticky subject because the ability to conceive a child varies so much from couple to couple, and the likelihood of a conceived child being carried healthy to full term is no sure thing either. A few websites (#1 and #2) suggest the chance of a healthy couple conceiving in a given month are less than 20% and the chances of that baby surviving till delivery are only around 70%. While these two percentages are certainly not independent probabilities, this puts a rough likelihood of (.20*.70) or 14% chance of being able to have a baby even remotely close to New Years on purpose.
Suppose you are able to successfully conceive and even place your order on the statistically perfect date (about Day 366-281 or day 85) what are the chances you'll deliver on New Years? This is the question all pregnant women want to know -- will I have my baby on my due date? Very unlikely. An informal survey shows only about 5% actually deliver on their due date. Again abusing the independence of these variables, which can certainly not be assumed, 5% of 14% is 0.7%, which is only slightly higher than 1/365 chance.
Of course, even if you are able to have a child on New Year's day -- what are the chances you'll beat all the other couples trying for the bronze booties? I suppose that depends on what town you're competing in. In my hometown of Grand Rapids -- how many babies are born on a given day? Ends up this was a very hard question to answer as I couldn't find a direct answer anywhere online. A few news articles suggest to me that there are only a handful born on a given day, and so you don't necessarily have to have perfect timing, although last years new years baby did. Another website suggested only a handful of babies were born on leap day, and only a few on 12-12-12.
I couldn't find any usable birth rate statistics anywhere for Grand Rapids Michigan, but I'm not going to let that stop me. With a current population of around 190,000 and a national annual birth rate of 13.5 per 1000
that yields approximately 190,000*13.5/1000 or 2565 births per year, or about 7 births per day. Of course, hospitals in Grand Rapids service a population larger than that, but not significantly larger -- maybe double? I remember looking in the nursery at St Mary's when both of our children were born and seeing less than 10 babies there, so I'm going to say that being the first baby born on New Years add's an additional 10% chance to things, yielding a final likelihood of 0.07% or 0.0007. This seems pretty consistent with the fact that 1 of those 2565 babies born had to be the first one born in a year, and 1/2565 is .0003. I'm sure I'm grossly simplifying things here, but it looks like if want to win those bronze booties -- than try. If you try, you'll roughly double your chances of having your baby be "the new years baby" in Grand Rapids as opposed to, say, just another baby.
And that half dozen of you friends and family members who are reading this and wondering -- no, we have no intentions of winning the bronze bootie in 2014.
I was wondering, as I always do, "What are the chances?"
Unfortunately, this question is hard to answer because it is kind of vague, so I'll try to tackle some of the different directions this question could be answered.
![]() |
| Popularity of Birthdays: Darker squares are more popular birthdays than lighter Image by The Daily Viz |
Assuming you want to try to have the New Years Baby -- what are your chances? This is a sticky subject because the ability to conceive a child varies so much from couple to couple, and the likelihood of a conceived child being carried healthy to full term is no sure thing either. A few websites (#1 and #2) suggest the chance of a healthy couple conceiving in a given month are less than 20% and the chances of that baby surviving till delivery are only around 70%. While these two percentages are certainly not independent probabilities, this puts a rough likelihood of (.20*.70) or 14% chance of being able to have a baby even remotely close to New Years on purpose.
Suppose you are able to successfully conceive and even place your order on the statistically perfect date (about Day 366-281 or day 85) what are the chances you'll deliver on New Years? This is the question all pregnant women want to know -- will I have my baby on my due date? Very unlikely. An informal survey shows only about 5% actually deliver on their due date. Again abusing the independence of these variables, which can certainly not be assumed, 5% of 14% is 0.7%, which is only slightly higher than 1/365 chance.
Of course, even if you are able to have a child on New Year's day -- what are the chances you'll beat all the other couples trying for the bronze booties? I suppose that depends on what town you're competing in. In my hometown of Grand Rapids -- how many babies are born on a given day? Ends up this was a very hard question to answer as I couldn't find a direct answer anywhere online. A few news articles suggest to me that there are only a handful born on a given day, and so you don't necessarily have to have perfect timing, although last years new years baby did. Another website suggested only a handful of babies were born on leap day, and only a few on 12-12-12.
I couldn't find any usable birth rate statistics anywhere for Grand Rapids Michigan, but I'm not going to let that stop me. With a current population of around 190,000 and a national annual birth rate of 13.5 per 1000
that yields approximately 190,000*13.5/1000 or 2565 births per year, or about 7 births per day. Of course, hospitals in Grand Rapids service a population larger than that, but not significantly larger -- maybe double? I remember looking in the nursery at St Mary's when both of our children were born and seeing less than 10 babies there, so I'm going to say that being the first baby born on New Years add's an additional 10% chance to things, yielding a final likelihood of 0.07% or 0.0007. This seems pretty consistent with the fact that 1 of those 2565 babies born had to be the first one born in a year, and 1/2565 is .0003. I'm sure I'm grossly simplifying things here, but it looks like if want to win those bronze booties -- than try. If you try, you'll roughly double your chances of having your baby be "the new years baby" in Grand Rapids as opposed to, say, just another baby.
And that half dozen of you friends and family members who are reading this and wondering -- no, we have no intentions of winning the bronze bootie in 2014.
Saturday, December 29, 2012
Probabilities of Phase 10 continued
Yesterday I wrote about some of the probabilities associated with the game phase 10. Today I'll investigate a few others. What are the probabilities of being dealt one of the given phases right away?
This sort of a question requires you to calculate how many different combinations of cards are possible for each hand, and divide that by how many different combinations of hands there are. The fact that there are wild cards, and that there are two blue 12's and two green 12's etc is a fact that complicates things beyond what I know how to handle, so I have ignored that in these calculations. I hope that hasn't distorted things too horrendously, and perhaps I'll return and clean this post up if I ever figure out how to handle it. If any of you readers want to instruct me, please leave a comment below.
The first calculation I will find is how many different hands of phase 10 there are. The mathematical function that does this is the choose function. (TotalToChooseFrom choose NumberNeeded) Since the deck has 108 cards, and I need to calculate (108 choose 10). Wolfram Alpha gives us this number: 38,722,819,230,810 different hands.
(Parenthetical note, indicated redundantly by the fact that this paragraph is in parentheses... The actual number of unique hands is less than this because of the aforementioned fact that there are multiple skip cards, multiple wilds and multiple blue12's, red12's, etc. This is what I don't know how to account for. This also suggests that each of my probabilities calculated below will be too low - except that they all have issues of their own because I didn't account for wild cards or repetitions in many of their calculations either).
So, how to calculate probabilities? Let's begin with my favorite phase -- getting seven cards of all the same color. First, choose which color you'd like to use out of the four. That's (4c1). Then, not counting wilds, there are 24 cards of that color, from which you must choose 7, or (24c7). Then choose 3 cards out of all the cards that are left -- that is 101c7. Multiply these probabilites together and you get:
Ways of choosing at least 7 of same color with no wilds
(4c1)(24c7)(101c3) = 230,712,926,400
To calculate proability of being dealt this then, divide this number into the total number of hands:
.2trillion / 38 trillion = .005 or 0.5%.
Including the possiblity of wilds increases the odds a little -- and for this phase doesn't complicate calculations much. There are still 4 colors to choose from, but now you have 32 possible cards to draw from instead of just 24:
Ways of choosing at least 7 of same color with wilds
(4c1)(32c7)(101c3) = 2,243,679,609,600 which is close to 6% probability
What follows is the number of combinations for most of the other phases. Being dealt them exactly is almost always less than 1 percent so I have not calculated the probabilities, but will leave them for you if you want.
Ways of choosing a run of 7 (no wilds):
(6c1)(8c1)(8c1)(8c1)(8c1)(8c1)(8c1)(101c3) = 262,117,785,600
Ways of choosing a run of 8 (no wilds):
(5c1)(8c1)(8c1)(8c1)(8c1)(8c1)(8c1)(8c1)(100c2) = 51,904,512,000
This sort of a question requires you to calculate how many different combinations of cards are possible for each hand, and divide that by how many different combinations of hands there are. The fact that there are wild cards, and that there are two blue 12's and two green 12's etc is a fact that complicates things beyond what I know how to handle, so I have ignored that in these calculations. I hope that hasn't distorted things too horrendously, and perhaps I'll return and clean this post up if I ever figure out how to handle it. If any of you readers want to instruct me, please leave a comment below.
The first calculation I will find is how many different hands of phase 10 there are. The mathematical function that does this is the choose function. (TotalToChooseFrom choose NumberNeeded) Since the deck has 108 cards, and I need to calculate (108 choose 10). Wolfram Alpha gives us this number: 38,722,819,230,810 different hands.
(Parenthetical note, indicated redundantly by the fact that this paragraph is in parentheses... The actual number of unique hands is less than this because of the aforementioned fact that there are multiple skip cards, multiple wilds and multiple blue12's, red12's, etc. This is what I don't know how to account for. This also suggests that each of my probabilities calculated below will be too low - except that they all have issues of their own because I didn't account for wild cards or repetitions in many of their calculations either).
So, how to calculate probabilities? Let's begin with my favorite phase -- getting seven cards of all the same color. First, choose which color you'd like to use out of the four. That's (4c1). Then, not counting wilds, there are 24 cards of that color, from which you must choose 7, or (24c7). Then choose 3 cards out of all the cards that are left -- that is 101c7. Multiply these probabilites together and you get:
Ways of choosing at least 7 of same color with no wilds
(4c1)(24c7)(101c3) = 230,712,926,400
To calculate proability of being dealt this then, divide this number into the total number of hands:
.2trillion / 38 trillion = .005 or 0.5%.
Including the possiblity of wilds increases the odds a little -- and for this phase doesn't complicate calculations much. There are still 4 colors to choose from, but now you have 32 possible cards to draw from instead of just 24:
Ways of choosing at least 7 of same color with wilds
(4c1)(32c7)(101c3) = 2,243,679,609,600 which is close to 6% probability
What follows is the number of combinations for most of the other phases. Being dealt them exactly is almost always less than 1 percent so I have not calculated the probabilities, but will leave them for you if you want.
Ways of choosing a run of 7 (no wilds):
(6c1)(8c1)(8c1)(8c1)(8c1)(8c1)(8c1)(101c3) = 262,117,785,600
Ways of choosing a run of 8 (no wilds):
(5c1)(8c1)(8c1)(8c1)(8c1)(8c1)(8c1)(8c1)(100c2) = 51,904,512,000
Ways of choosing a run of 9 (no wilds):
(4c1)(8c1)(8c1)(8c1)(8c1)(8c1)(8c1)(8c1)(8c1)(99c1) = 6,643,777,536
Ways of choosing a set of 3 and another set of 3 (no wilds):
(12c2)(8c3)(8c3)(102c4) = 879,560,035,200
Ways of choosing a set of 4 and another set of 4 (no wilds):
(12c2)(8c4)(8c4)(100c2) = 1,600,830,000
Ways of choosing a set of 5 and another set of 2 (no wilds):
(12c2)(8c5)(8c2)(101c3) = 17,246,275,200
Ways of choosing a set of 5 and another set of 3 (no wilds):
(12c2)(8c5)(8c3)(100c2) = 1,024,531,200
Ways of choosing a set of 3 and another run of 4 (no wilds):
(12c1)(8c3)(9c1)(8c1)(8c1)(8c1)(101c3) = 516,044,390,400
Ways of choosing a set of 4 and another run of 4 (no wilds):
(12c1)(8c4)(9c1)(8c1)(8c1)(8c1)(100c2) = 19,160,064,000
Probabilities of Phase 10
We were playing a card game the other day and I couldn't resist making some back of the napkin calculations of probabilities.
The game was Phase 10 -- a stupid game that I can never win. The point of the game is to collect certain combinations of cards faster than your opponents.
There are 108 cards in a Phase 10 deck:
To begin each hand, 10 cards are dealt to each player. After dealing and several turns have been played, in one round I have come to have these cards:
In the picture above, you can see I have a wide variety of cards, and two wilds to use. I am trying to get a run of 9 consecutive cards, and am almost there. I'm wondering, what is the probability of me drawing the card I need from the deck at random? I have to do this because my opponents are being stingy and purposefully leaving me cards that are not helpful, because they have been observing what I've picked up in the past few turns.
Well, at this point in the game there have been 30 cards dealt out, and an additional 12 cards played, which means there are 108-30-12 or 66 cards remaining. I am in search of 3, an 8, a 9, a 12, or a wild card, as any of them would allow me to complete the run and play my hand. I have not seen any 3's, 8's, 9's, 12's, or wilds played by my opponents, but I wouldn't expect to see them -- and especially not wilds, as those are seldomly discarded.
At worst, my opponents could be secretly collecting these cards -- and have all of them in their hands -- or could they? There are 8 each of the 3's, 8's, 9's, and 12's, and 6 more wild cards out there, which means there are a total of 38 cards that I could win with that are unaccounted for. Even if my opponents were both incredibly lucky (not likely) and incredibly mean (possible...) that would still leave 18 winning cards available out of the 66 in the deck, for a minimum probability of 27%.
At best, my opponents might have none of these cards -- leaving all 38 as possible cards to draw from in the deck of 66 -- yielding a maximum probability of 58%.
Chances are likely that something in between is true -- perhaps my opponents have a few of these cards, but not all of them. I'll have to assume that my potential winning cards have been evenly dispersed amongst all of the other cards I don't have -- and even though I can't draw from my opponents hands, I should include the cards they have in my probability calculations. That means there are 66 + 20 or 86 cards to "draw from" and 38 possible winning cards, or a probability of 44%.
I figure I can last another three turns or so before one of my opponents goes out first. This isn't as much of an arbitrary guess as you might think -- a lot of times you can tell by how many cards a player still has how many turns you have left. What then are my chances of winning? I should be guarenteed right? 44*3 is over 100%! Unfortunately it's not that easy, but must be calculated by subtracting my chance of losing from 1. My chance of losing is my chances of not getting a card I want 3 times in a row. There is a 100-44 or 56 percent chance that the card I draw next will not help me. Therefore, my chances of losing are (.56)(.56)(.56) or 17%. This means my chances of winning are pretty good -- or around 83%.
Unfortunately, I did not win, but when you're playing your wife, winning is always best, and sometimes losing is a victory. Occasionally you need to lose a battle to win the war. Er... to avoid war? I mean, I love you honey!
The game was Phase 10 -- a stupid game that I can never win. The point of the game is to collect certain combinations of cards faster than your opponents.
There are 108 cards in a Phase 10 deck:
- 96 numbered cards numbered 1-12, 2 of each in four different colors
- 4 skip cards
- 8 wild cards
To begin each hand, 10 cards are dealt to each player. After dealing and several turns have been played, in one round I have come to have these cards:
What are my chances of drawing what I need?
In the picture above, you can see I have a wide variety of cards, and two wilds to use. I am trying to get a run of 9 consecutive cards, and am almost there. I'm wondering, what is the probability of me drawing the card I need from the deck at random? I have to do this because my opponents are being stingy and purposefully leaving me cards that are not helpful, because they have been observing what I've picked up in the past few turns.
Well, at this point in the game there have been 30 cards dealt out, and an additional 12 cards played, which means there are 108-30-12 or 66 cards remaining. I am in search of 3, an 8, a 9, a 12, or a wild card, as any of them would allow me to complete the run and play my hand. I have not seen any 3's, 8's, 9's, 12's, or wilds played by my opponents, but I wouldn't expect to see them -- and especially not wilds, as those are seldomly discarded.
At worst, my opponents could be secretly collecting these cards -- and have all of them in their hands -- or could they? There are 8 each of the 3's, 8's, 9's, and 12's, and 6 more wild cards out there, which means there are a total of 38 cards that I could win with that are unaccounted for. Even if my opponents were both incredibly lucky (not likely) and incredibly mean (possible...) that would still leave 18 winning cards available out of the 66 in the deck, for a minimum probability of 27%.
At best, my opponents might have none of these cards -- leaving all 38 as possible cards to draw from in the deck of 66 -- yielding a maximum probability of 58%.
Chances are likely that something in between is true -- perhaps my opponents have a few of these cards, but not all of them. I'll have to assume that my potential winning cards have been evenly dispersed amongst all of the other cards I don't have -- and even though I can't draw from my opponents hands, I should include the cards they have in my probability calculations. That means there are 66 + 20 or 86 cards to "draw from" and 38 possible winning cards, or a probability of 44%.
I figure I can last another three turns or so before one of my opponents goes out first. This isn't as much of an arbitrary guess as you might think -- a lot of times you can tell by how many cards a player still has how many turns you have left. What then are my chances of winning? I should be guarenteed right? 44*3 is over 100%! Unfortunately it's not that easy, but must be calculated by subtracting my chance of losing from 1. My chance of losing is my chances of not getting a card I want 3 times in a row. There is a 100-44 or 56 percent chance that the card I draw next will not help me. Therefore, my chances of losing are (.56)(.56)(.56) or 17%. This means my chances of winning are pretty good -- or around 83%.
Unfortunately, I did not win, but when you're playing your wife, winning is always best, and sometimes losing is a victory. Occasionally you need to lose a battle to win the war. Er... to avoid war? I mean, I love you honey!
Monday, December 17, 2012
"Random" Thoughts
I hear the word "random" used all the time, and so often incorrectly. It seems like it is some of my high school students favorite words, and expressions. I bet I hear at least once a day, "That's so random!!"
Spur-of-the-moment: occurring or done without advance preparation or deliberation; extemporaneous; unplanned. I pick a lot of numbers on the spur of the moment over the course of a day, as I make up quick examples for class. I don't pick them randomly, and I know that I favor certain numbers like 2's and 3's. There is usually little meaning behind the choice of numbers, but they were not chosen randomly.
Spontaneous: resulting from internal or natural processes, with no apparent external influence. I often hear of people described as random -- especially those that are really funny and come up with the weirdest things "from out of nowhere". These people aren't dice-rollers. They don't have thousands of thoughts rolling around in their head waiting to fall out their mouths like some sort of lottery. They are spontaneous, and the world is a better, funnier place because of them. Learn the word. Use it.
Here's a few thoughts on the word, and some alternatives that perhaps you ought to consider instead.
Random: If something happens randomly, it means that one option out of many different equally possible options occurred. This was not something someone chose. This event could have occurred a different way if things had happened just a little differently. Imagine a dice rolling and coming up a four. It could just as easily come up a 5. This is what random means. Side note: Random things will sometimes repeat. A dice will sometimes come up with the same side showing twice in a row. In fact we can predict how often that will occur (about 17%). Your iPod does not play songs randomly -- because if it did you would complain that it wasn't "random enough". If it really did pick a song at random, you would hear repeats occasionally, and the first music players actually did this. Your iPod probably is using a shuffled play list - which did use random choice to create the list by choosing one of the songs to play first, one of the remaining songs to go second, one of the remaining songs to go next and so on.
Haphazard: Lack of a plan, order or direction. A person who doesn't know where they are going is not driving "randomly". They are not flipping a coin to decide when to turn left or right.
Arbitrary: Determined by chance, whim, or impulse, and not by necessity, reason, or principle. An arbitrary decision is one that could have been lots of things, and the decider just picked one of them because a decision had to be made. Perhaps they could have made the decision randomly, by drawing draws or rolling a dice, but instead just made up their mind.
Assorted: Literally (and don't get me started about "literally" misusages) "not"-sorted. This rant was purposefully misnamed Random thoughts, thought a more appropriate word to use is assorted. I suppose I could have put these words into a shuffling algorithm and randomized them -- or sorted them alphabetically, but I just put them down as they came to me.
Unexpected: If you didn't expect something was going to happen, then describe that outcome as unexpected, not random. The fact that we had a fire alarm during third hour was not random -- in fact, it was probably planned. You just didn't expect it. Surprise!
Aimless: Sometimes people do things that are pointless, and serve no purpose. Putting a picture of a cute penguin on a blog post about randomness might not serve any purpose, but that doesn't make it random.
Wednesday, July 11, 2012
What's the comma good for?
![]() |
| How NOT to add the large numbers: 324,568,116 + 538,246 |
So, what is the comma there for then, if not to separate large numbers into chunks of three digits? Here's a handful of reasons the comma is useful, and things you can use it for:
- An argument separator: the most common use of a comma on a TI-83 or TI-84 is to separate different inputs of a function. Lots of words here... let me summarize:
function - some sort of a command that takes input from you and calculates something.
argument - the "input" that you put into a function
Here's a few examples: Hidden in the Math button are some functions you might want to know about that require more than one input. Try typing in gcd(100, 84) and you'll find that the calculator will give you the greatest common factor (or divisor) of 100 and 84. Notice because you had two inputs, you had to separate them with a comma. Further right in the menu is randInt(1,6) which will give you a random number between 1 and 6, like rolling a dice. Add a third number in like randInt(1,6,5) and it will give you a list of random numbers, as if you rolled 5 dice, like if math class was really boring and you wanted to play Yahtzee but knew the teacher would be annoyed with the sound of dice on your desk.
- A list separator: you can also create lists of numbers in your calculator, using the braces {} and commas. You might want to do this if you are doing things with statistics, or if you are trying to answer many different questions at once. There are different list functions in the List menu, and in the Stats menu. Usually I will type my list up, say: {1, 3, 5, 7, 9, 11} and then store it using the STO button, and then I can do all sorts of things with or to the list, a few of which are demonstrated to the right.
- A matrix separator: similar to the lists option, this will help you to create and store a matrix of numbers, for which you need to use the [] brackets instead of parentheses. Matrices are far to rich a topic to explore in depth here, and I think it's much easier to use the Edit option in the Matrix menu when I work with them myself, but you can type up a matrix on the main screen, or in the programming screens by using [ [a, b, c, ...] [d, e, f, ...] ...] if you wanted to, and when programming its the only way.
- An ordered pair separator: if you have a set of x,y coordinates, you use the comma to tell the calculator when x stops and y begins. Among other places, there are a few useful functions in the Angle menu that require you to enter in an x- and a y- coordinate, such as when calculating the length and angle of a vector? Suppose you want to know the distance from (0,0) to (3, 4) and what angle you need to travel at? Type in R>Pr(3,4) and R>Ptheta(3,4) to get the distance (5 units) and the angle (~53 degrees).
Labels:
algebra,
calculator,
math,
matrix,
precalc,
probability,
SummerMathSeries,
trigonometry
Tuesday, July 3, 2012
Do I need to order more orange beads?
This past week at my church we are doing Vacation Bible School, using Group's Sky Curriculum. My role is to lead the imagination station, which is a small 15 minute block of time where students essentially create a little mini-science demonstration, relate it to how God works in their lives, and create a small take-away activity they can bring home to show their friends and parents.
One small part of this station is an opening question to get the students thinking about the idea of the day. This question is a "would you rather" type of question that has only two possible answers -- and the students depending on their answer select a little orange bead or a little blue bead, which they keep. At the end of the week, some students might have responded with the first option each time and have 5 orange beads, or perhaps have five blue beads, or most likely something in between.
We anticipated 100 students, and bought 3 beads of each color for each student, so we have 300 orange beads, and 300 blue ones, as was recommended by the company. My concern was that today's question was highly skewed in direction of the orange, so even though we have only 94 students, 75 of them received an orange bead, and only 19 took a blue one. I'm wondering if I should order more beads, or trust that in the grand scheme of things, it will balance out?
To answer this question, I need to invoke a little work with probability. To do so, I am going to make a few assumptions, which as always I'll list before getting started:
One small part of this station is an opening question to get the students thinking about the idea of the day. This question is a "would you rather" type of question that has only two possible answers -- and the students depending on their answer select a little orange bead or a little blue bead, which they keep. At the end of the week, some students might have responded with the first option each time and have 5 orange beads, or perhaps have five blue beads, or most likely something in between.
We anticipated 100 students, and bought 3 beads of each color for each student, so we have 300 orange beads, and 300 blue ones, as was recommended by the company. My concern was that today's question was highly skewed in direction of the orange, so even though we have only 94 students, 75 of them received an orange bead, and only 19 took a blue one. I'm wondering if I should order more beads, or trust that in the grand scheme of things, it will balance out?
To answer this question, I need to invoke a little work with probability. To do so, I am going to make a few assumptions, which as always I'll list before getting started:
- Each of the remaining four days I will also have 94 students
- Each of the remaining four questions will be "fair" meaning a student would pick either option with 50% likelihood.
To begin, suppose worst case scenario, every student from here on out chooses the orange response. That would mean 94+94+94+94 more orange beads are given out, plus the 75 I've already given away which would be 451 total orange beads, or 151 more than I have. So one solution could be to order another 151 beads (they come in packs of 100 though, so I'd have to order 200 more) and then I'll know I'll be safe -- at least with orange.
How many beads do I have left anyway? 300-75 = 225. Divided by four days, means I have an average of 56.25 beads I could give away each day, which would mean students would average their responses to less than 56.25/94 = 59% favoring orange. Hmm... a little nervewracking, but if any of the days is a blue-heavy day, than that probability would go up, and surely one of the days will be blue-heavy, right?
Ultimately, this can be simplified to a 'coin-flipping' problem. I have 94*4 or 376 more beads to give away, some of which will be orange and some will be blue. If I split 50/50 I'll give away 376/2 or 188 more orange beads, which is well under the 225 I've got left. What I'd ultimately like to know is what is the probability that I'll have to give away 226 or more beads? That is, if I flip a coin 376 times, what's the probability that I'll get 226 heads?
This question is simple enough in concept to answer, but because of the large number of flips needed, it will be a little more difficult to practice. The concept is simply to find out how many different combinations of orange/blue giveaways are possible - lets call that X - and then count how many of those options contain 226 or more orange beads -- lets call that O. A probability is always the number of combinations that win (or in this case, "lose") divided by the total number possible, so using our notation, that's O/X. Lets look at a simpler question, and then we'll return to the question at hand.
Suppose it was the last day and we had only five students. What responses are possible. Suppose I had 3 of each bead -- what's the probability that I'll be able to give the students what they need?
First, lets figure out how many combinations are possible, which I'll do by listing, because there aren't that many (2^5 is 32 -- so I can do that relatively painlessly)
ooooo oooob ooobo ooobb ooboo oobob oobbo oobbb
obooo oboob obobo obobb obboo obbob obbbo obbbb
boooo booob boobo boobb boboo bobob bobbo bobbb
bbooo bboob bbobo bbobb bbboo bbbob bbbbo bbbbb
That's 32 possibilities, which means in this example, X = 32.
Now lets highlight the ones that I can handle -- that is, the cases that give away at most 3 beads of any color -- because I don't have four.
ooooo oooob ooobo ooobb ooboo oobob oobbo oobbb
obooo oboob obobo obobb obboo obbob obbbo obbbb
boooo booob boobo boobb boboo bobob bobbo bobbb
bbooo bboob bbobo bbobb bbboo bbbob bbbbo bbbbb
There are 20 possible outcomes that will ok, which I've highlighted. That means our O = 20. The probability that I'll be able to give things away with no difficulty then is O/X = 20/32 or 62.5%.
Now the same process could theoretically be used to answer the real question at hand, but each possible chain is 376 letters long, and I would have to list 2^376 possibilities, which is a number that has 113 digits in it. No thank you. Not to mention I would then have to look through each of those combinations to see which ones have 226 or more orange beads....
Thankfully, there is a shortcut, and even though these calculations involve enormously big numbers of possibilities, a calculator can handle them for us. One such calculator that I used can be found online, and the relevant numbers you would need to type in are n = 376 (number of flips) k = 226 (highest number of flips of one type desired) and p = .5 for 50% probability per flip. You may also use a TI-83 or TI-84 in which case you're looking for the binomialcdf function in the Distribution menu. (More info) When I calculated the answer, I got a 0.0052234269% possibility of running out of orange beads. I'm fairly confident I'll be ok, as long as the rest of the questions are basically 50-50.
Tomorrow we'll continue this discussion, and see how a little triangle of numbers can help us answer this question.
Subscribe to:
Posts (Atom)