Pages

Monday, November 26, 2012

Mad Libs with Mail Merge

Every time I hear the song Let it Snow, Let it Snow, Let it Snow! I am reminded of an activity I did once several years ago when I used to teach computer applications. We were learning about mail merge features in Microsoft Word. We had finished an assignment on making form letters (actually, we made letters to send out to each of our family members informing them each of a different gift on our lists insuring that they each bought us something different we wanted) and had an extra day before leaving for break so I decided for the last day to try a funner use of mail merge.  So, we made Mad Libs.  Christmas Carol Mad Libs.

Acid Rain: (more info)
Students took 15 minutes or so to set up files, about 15 minutes to go from computer to computer filling out each others mad libs, and the last 15 minutes or so reading what ensued.  My favorite line -- the only one I remember actually, is:
"Let it Acid Rain! Let It Acid Rain! Let It Acid Rain!
The student had put "type of precipitation" in as a clue, and while most people put either rain, or snow, there's always that one kid that thinks a little differently.

If you're curious how to make it work, I copied and pasted my instructions down below.  These were based on the 2003 version of word, so the exact places you go to find these options have probably changed if you have the newer versions. Some of these instructions were specific to my students that year -- please forgive me if I didn't filter all of them out.


  1. Create a folder in your personal space called "madlib"
  2. Open a new Microsoft word document save it as "mymadlibsong" in that madlib folder.
  3. Find the lyrics to a christmas song of your choosing online, and paste them into "mymadlibsong".
  4. Go through your song, and remove certain keywords which you would like to be blanks that need to be filled in with words.  Delete the old word and in its place type some type a field name that you will replace it with.  e.g.  Rudolph the ADJECTIVE1-nosed ANIMAL1...  (Notice that I have a 1 after adjective, that's because each field needs a unique name -- otherwise EVERY adjective in the song would be replaced by the same word.  If I have another adjective later, I would ADJECTIVE2, etc.
  5. From Tools, choose Mail Merge...
    1. Click create main document, form letters, Active Window
    2. . Get Data, Create Data Source...
    3. Remove all the prearranged field names that Word gives you
    4.  Go through your whole story from top to bottom and add the fields that you created above.  Remember that each field name requires a unique name, which is why I have adjective1, adjective2, etc.  
    5.  Click OK and save it as "mywordlist" in madlib folder
    6. Choose "Edit Data Source"  The Data source is what MsWord calls the document which contains all the information that will be placed into the main document, or in this assignment, the data source is the wordlist, and the main document is the story.
    7. You can words if you'd like, enter at least one set of words.  If you have come up with one set of words -- called a record -- either enter another set, or have a friend or neighbor enter a set
    8. When you are finished entering words (at least for now) hit OK.
  6. Notice now the Merge toolbar has been added to your bar. The first available button is insert Merge field.  If you click on that button, you'll see your list of fields that you can place in your document in the appropriate locations.  Go through your document and replace each of the field names you typed earlier with the appropriate mergefield. It should look like <<ADJECTIVE1>>.  
  7.  When you are complete finished, press the button with <<>>ABC on it and you'll find that each of the merge fields has been filled with the lyrics that you and your friends have come up with!  Click the > button to read through each of the records you created.
  8. To make another verse. Click the MailMergeHelper button, and you'll see the familiar menu. This time click Edit Source Document.  Add another verse, either yourself, or by asking me or a different friend to fill yours out.  Before you hit ok, click View source.  You should see another word document pop up with a table containing your words -- much like an excel spreadsheet.  Both can be used.  Typically it is easier to create a file this way, but sometimes, if you already have an Excel document made up, it will be easier to use that information already. Close the source file, saving any changes you may have made, and try reading the new verses you made.
If you try it and come across any issues, comment below and I can try to help. If you try it and come up with a cool verse, comment that too!

Saturday, November 24, 2012

Answer Key's to Worksheets

I believe that students do need to practice a skill in order to get good at something. This often translates into lots of questions and problems and opportunities for students to practice. Typically, for my math and physics classes, this takes the form of worksheets or practice problems out of the book. 

One thing I try to make sure I have for my worksheets or assignments however is some way for the students to know if they are getting it right. 

For my algebra assignments out of the book -- I remind my students that math textbooks almost always have an answer section in the back, and I tell them to check their work as they go. (One thing I have not done that just came to mind is model to them what that looks like in practice, and how to deal with mistakes...) For assignments that do not have answers, I have been known to write all the answers on the board, or on the bottom of a worksheet, but in random order. This way the students have to come up with an answer, but if they see that answer on the board then they have some confidence that they did it right. To avoid process of elimination at the end, I usually throw a few more answers up than I assigned.

My physics assignments typically come from several sources -- a hardcopy textbook, made up questions on worksheets, or several handouts of supplementary practice problems. Most of these do not have a ready made answer sheet, or have multiple parts that should be checked along the way before arriving at the "final answer". For many of these assignments, I provide the answers in a multiple choice format:
      m = {1.20,     1.47,      1.93,       2.31,     2.88,    3.06} kg

One of the six options listed is the correct mass, and the other 5 are just random distractors. The idea came to me when one of the students complained to me "Can you just give us the answers?".  At first I thought, "Of course not!" but then I remembered my assignments at MSU where we had to enter our answers in online, and they would tell us if we were right or not. I remember being frustrated at these assignments, but in a good way because I kept returning to the problem and trying to figure out what was wrong until finally I found an answer that worked. I haven't taken the time to find a way to do that with my assignments yet, but having the answers available for students is a step in that direction perhaps.  

To help me come up with such answers, I set up an excel file that I can enter the correct answer in one cell, and it will come up with six answers that are all reasonably close in size compared to that answer.  The correct answer is randomly placed somewhere in those numbers:
If you want to try it for yourself, you may download it here.  To adjust where the answers round to, select the options and push the rounding button in the number tab above, highlighted in yellow above. 

To create a worksheet for the students then, I typically have this file open and copy and paste the answers in.  One thing I have found necessary is to "Special Paste" them in -- by pressing Alt E, S and paste them as unformatted text instead of cells from a spreadsheet. That way the formatting looks good, and the numbers in the worksheet are fixed instead of linked to the constantly changing excel file.  

Thursday, November 22, 2012

Thanksgiving Wishes

Thank you. (no, this isn't me...)
Happy Thanksgiving everyone!

I wanted to take a few minutes and express my gratitude to God and all of you for what you have done in our lives. Here is a short list of the things I am thankful for:

  • My wife Carrie: She is the one of the least selfish people I have ever met. I cannot imagine life without her. She works so hard to take care of us all, and has enabled me to do my best at my job. I love you. I am inspired by her daily to spend more time playing with and caring for ...
  • My daughters: The two of them have been such tremendous sources of ... emotions. Mostly joy and laughter and happiness, but also times of frustration and fear. I can't imagine life before them anymore -- it must have been so boring and flat!
  • My family: Though it took me a while to appreciate all the changes a step family brings with it, I am grateful for their role in my life. My step mom has been working so hard at a new job, and yet continues to be so generous and excited to see her granddaughters. I've enjoyed being able to assist her over the last few months in helping create an updated electronic medical form for her job. It's really helped me to be able to connect with and work with her on a project. My dad continues to show his love to me,  most recently through allowing me to play tennis with him and his friends on Monday nights -- something I didn't know how badly I needed. I'm also grateful for the changes God has done in the rest of my family -- a new baby on the way, new steps in careers, and a miraculous healing and removal of cancer have been announced in just the past six months. Praise God for all these changes. Every night Abby and I thank God and pray for each one of you!  
  • My "family": Another family that has been especially helpful for me is my church. They take such good care of our daughters. Every Sunday our girls are cared for by someone in nursery and my wife and I never have to worry about who's got 'em. Special thanks goes to "Miss Meghan" and to the Wittenbach's who have been babysitters, often for free, to the girls and enabled my wife and I to serve the chuch via ...
  • Music.
  • My job:  I love being able to use my gifts and talents and interests so perfectly in my position as a teacher and coach at NorthPointe Christian. Every year I find new ways to teach better, and grow. I appreciate how hard they work to make sure people are serving in their capacities, and not asking people to do things they aren't skilled at. I am also grateful for how quickly and powerfully they come together in prayer for each others needs.
Thank you for reading and appreciating God's providence in my life over the last few years.  May you have a blessed Thanksgiving this year!

Word Blanks using Microsoft Word's Styles

I have notes available in Microsoft Word for my students, and one of the things I have found most helpful is creating and using styles. Styles are quick formatting options that can be used and reused from file to file.

To find Styles in Microsoft Word, press Ctrl-Shift-S. A list of available styles should come up. These are probably preset styles that come automatically. To apply a style, select some text and click on one of those styles and you will see it change.

While applying the built-in styles is kind of helpful, the real power of styles is when you adjust and control what you want styles to look like. Or when you create new styles of your own. One thing I found myself doing over and over again was creating fill in the blanks for my students in their notes. One problem I had was I would often forget what the word was myself. I found myself making two files all the time -- one which had blanks in it, and another that had the answers. This was a nightmare to manage and I found a solution with styles.

I created a new style called WordBlank. Then I typed up my "answer key" version of the notes, and as I found words that I wanted to blank out, I applied this new WordBlank style to them. When I was done typing it, I modified the WordBlank style by pressing the Modify... button.

Several formatting features made the blanks look just the way I wanted them to.

  • Set to underline.
  • Set the underline color to Black
  • Set the words to be e x p a n d e d.  This is because students handwriting takes up more space then text does, and so the blanks needed to be wider than they would naturally appear.  Alternatively you could just make the font size a little bigger than normal too, or some combination of both.

When I was done, all the words in the document that I had applied the style to looked like this:
Now I could print if I wanted to and have an answer key.

But the real genius was that in this one file, now I could modify the style and change one thing:

  • Set the font color to white


And now the file changed to this:

Then I could print off student copies!  

Now, all of my notes files have this style in them. To make that easier, I pushed "Manage Styles" and made sure to copy that style into my Normal file, so that every time I start a new word document, WordBlank is one of the options I have available.  

Also, since I have all these files available on my class website for students to download, they can access them. Since the blanks are there -- if the students are sick or absent, all they have to do to get the notes is to select the blanks and change them to a different color. And yes, I show them how to do this early on in the year.

If you want to download a document that has my wordblank style in it, try these Momentum Notes.

Wednesday, November 21, 2012

Geogebra Activities In My Classroom

I have been spending a lot of time playing around with Geogebra lately -- in my algebra and precalc classes. I love this program because of how easy it is to make functions come alive and allow you to tweak things and see the effect they have. Below I have embedded an example of a geogebra activity I made to help illustrate how transformations change the graph of the basic sine curve.

Sorry, the GeoGebra Applet could not be started. Please make sure that Java 1.5 (or later) is installed and active in your browser (Click here to install Java now) If you can not see it, you might need to update or install Java on your computer. If you can see it, play around with the sliders in the corner -- move them and you will see how the graph adjusts. These are concepts that we delve out in more details of course in class, but this is a tool I use at the beginning of the unit to introduce the idea. It is also something I allowed as an option for my students to make at the end of the unit as an assessment of their knowledge. It takes minimal knowledge to create a graph that moves with sliders -- I can show a student how to do that in about two minutes.  But to add to the graph the other colored lines and line segments that make it so clear what a, b, c, and d do require more advanced programming thinking, and a strong knowledge of the keypoints that are on a graph.

I have made other geogebra activities too -- another of my favorites is to make a guessing game of graphs. By assigning some code to a button, you can have geogebra create a new random graph. So I do that, and then create another controllable graph and have the students try to match the random graph. Here is an example I just had my algebra students playing with the other day:
Sorry, the GeoGebra Applet could not be started. Please make sure that Java 1.5 (or later) is installed and active in your browser (Click here to install Java now)
After a quick demonstration in class, we moved the the computer lab and they spent some time playing around trying to type the equation of the blue line. I could have just given them a worksheet to do, (and seriously thought of it as bad as I was feeling yesterday with a pounding headache) but I preferred this activity instead. It was:

  • A change of pace and scenery
  • Motivating - there is something satisfying in "getting it!" 
  • Self-checking. I believe this is one of the most critical points of an drill-like activity in a math class. If students don't have instant feedback that they are doing something correct, or incorrect, they will quickly develop habits that are hard to undo.
If you are interested in learning more about creating geogebra activities like these, be sure to check out future posts.  

Sunday, November 18, 2012

Are you in radians or degrees? Who cares!?

We're to the point of the year where my precalc students are doing more and more things with radian angle measurements instead of just simply in degrees, so I find myself needing to ask more and more often: "Are you in radian mode or degree mode?" when my students give me an answer from their calculators. You see, if students use their calculator to find a trig value for an angle in degrees, but their calculator is set up in radian mode from making the last graph, then they'll end up reporting an answer that's incorrect. But is that answer too high? Or too low?

It got me thinking, is there some sort of an angle that I could give them where they could incorrectly look up the value in radian mode, and yet by sheer coincidence end up with the same value for degree mode?  That is, are there any angles where:
     

To begin, 0 degrees and 0 radians are the same amount, and so all the trig ratios compute correctly regardless of what mode you are in if the angle is 0.  But for angles greater than 0, a degree is significantly smaller than a radian, and so sine and cosine values will quickly vary significantly depending on what mode you are in.

To convert an angle from one form to the other, I typically use the conversion that 180° = Ï€ radians, so to convert from radians, multiply by 180/Ï€.  Roughly speaking this conversion is approximatly 57° per radian, or quite roughly, about 60°. Since they are on different sized scales, there is no other angles (besides zero) where an angle in degrees is the same as in radians. Or are there?

Because of the way angles are defined as rotations around the origin, angles greater than 360° end up being equivalent to (technically "coterminal" to) other angles less than 360°.  For example, 400° is, for all practical trig purposes, identical to 40 degrees, which is 40 degrees further than one complete rotation.  The ratio sin(400) is equivalent to sin(40).  This is true for radian angles too.  A complete rotation is equivalent to 2Ï€ or approximately 6.28 radians, so an angle of θ = 7 radians is equal to 7-2Ï€ or .7168 rad.

Does this brings up the possibility of some overlapping values perhaps?  32 radians is equivalent to .584 radians (after subtracting 5 full rotations of 2Ï€ away) and .584 radians is approximately 33.4 degrees.  That suggests to me that there is probably an angle near here where the two would line up exactly!  But how to find it?

Let's let θ be that angle. I want to find the angle such that  or after a conversion:


After a little rearranging, I get:
     
and
     .
So 32 degrees is basically coterminal with 32 radians. If I want to guarantee that my students don't get their question wrong on the test because of this issue, I should make sure that I ask them what sin(31.97) is. Or, if I want to make sure they don't get any false positives and get a question correct that they don't really know how to do, I should avoid asking such questions on the tests.

This formula can be generalized by allowing any number of rotations around the circle, and presents a handful of different angles which give the same result whether in degrees or radians, by changing the specific number 5 to any integer n:

which gives the first seven angles of:  0, 6.4, 12.8, 19.2, 25.6, 32, 38.4, and 44.8.  With so many angles where their measure and radians and in degrees overlap, it's a small surprise that in all my years of teaching I've never stumbled across one on accident before!  In my examples, I typically come up with angles in degrees, and every six or so degrees there's a correlation. That suggests one time out of every six where I come up with an angle "at random" I ought to have found one!  I wonder how many times I've done it and a student has gotten answers that "kinda matched" what I had in class but were slightly off?  How many times did I just tell them they rounded wrong?

Now the truth is there are even more opportunities where this could happen when using trig functions because they can overlap even within the same units!  For example, sin(75°) = sin(105°). How many more "angle pairings" could this give?  I didn't take the time to find an equation that allows me to calculate them all, because I imagine one of you readers who's interested could probably do it and type it up in the comments, but I did make a graph showing where the angles occur in the first quadrant:
Graph of:
There are twice as many angles, which I probably could have guessed if I had thought about it a little bit. The angles we found earlier are represented by A, C, E, G, I and K, and it looks like nearly halfway in between each of those is another angle.  This suggests that close to one in every three angles I give as an example for calculations of sine ought to give me results that are similar in either degree or radian mode.


Saturday, November 17, 2012

Impulses Reflection

Just a random dinosaur that
has nothing to do with this
post but a student included
in their paper saying: 
  "this is also important"
Recently I asked my students to write a short essay on the concept of impulse, and how they had experienced different types of "personal" impulses in their lives. Below are some snippets of their responses, which mainly revolved around the difference between quick and gradual impulses. First, let two of my students explain what impulse is:
Impulse is a change in momentum. The equation is Force multiplied by the change in time. The change in time is important because a large amount of time causes a gradual change in momentum.  A short amount of time gives a sudden change in momentum. With more time, there will be less force. With less time there will be more force. With less time, the force is more painful. 
As a formula, impulse looks like this:    Another student shared a concrete example of the different types of impulses:
A car braking gradually for a stop sign would be an example of small force acting for a long time, and a golf club hitting a ball would be an example of large force acting very quickly.
After a brief introduction, I asked the students to think about their personal lives and describe what sorts of changes have occurred, and describe them in relation to impulses. Many of them shared responses of loved ones who had passed away, perhaps because I lead them in that direction when I described incidents in my own life as examples. I have been touched by both types of impulses with my mom passing away after many years of fighting cancer, but also with sudden unexpected deaths, with my aunt, a friend in middle school, and most recently the wife of a colleague. Below is one quote of a gradual passing that reminded me a lot of my own mother:
It didn’t happen too quick to the point we weren’t expecting it, so we were ready and prepared ourselves for it. Then when she did pass we weren’t devastated but happier for her that she finally got to go home.
I struggle some times with feelings of guilt because I did feel happier after she died. Don't get me wrong, I shed many tears too, and still do at times now eight years later, but I felt some freedom and release when she was no longer struggling in pain, and needing constant care taking.

The other common response was that day-to-day living and growing up was a commonly described gradual change in their lives. One described his reading and re-reading of a particular book and how each time he read it he learned more about he justified sin in his life. This lead to continual refining and sanctification. At other times he described his life being punctuated with quick periods of growth, most notably after attending several youth conventions.

A lot of times these day-to-day growing changes are hard to notice, because they happen over such a large amount of time:

An example of a more gradual change in my life is growing up in general. I don’t notice change from one day to the next but I look different than I did last year or the year before that. It takes a long time to notice any change, but it does happen. Although it is more noticeable when you are younger you are still changing a little every day. 
That last observation is so true! As I've gotten older it has become much harder to notice changes in my life, but my kids seem to be changing drastically! Another student reflected on growing up and described: 

Recently, I have looked back and noticed how much my friends and I have grown. We all gradually matured. Growing up was a slow impulse that changed the motion we were heading, and none of us noticed we were in the process of growing until one day we realized, “Wow, we are so different than who we were.”  

I''ve done this reflection exercise twice now in physics class, and both times have appreciated the responses the students gave. Both times I've felt nervous describing the assignment, fearing the students would find connecting a physical concept to their personal lives as forced, or hokey. But twice now the students have responded with sincere thoughts, and I have been encouraged to continue to make personal connections and spiritual applications to the concepts we study.  One student described this reflection process:
 The joy in life is to find the changes and see what improvements we have made in the areas in our lives that need working on. 
It's important to reflect on growth. Just the other day I found a journal from my first two years of teaching and was amazed at some of the things I used to feel and think, and how they have changed. I was also amazed at what hasn't changed.

Oh, and maybe the dinosaur at the top of the page was actually very relevant, instead of just a random addition to a students paper. Did they die out gradually or suddenly? But I think that's a post for another day.

Has your life been impacted more by gradual changes or sudden events?

Thursday, November 15, 2012

US-Income Compared to US Median Household

I have a hard time wrapping my mind around the immensity of the Federal Budget, so I decided to look up a handful of numbers and see if I can put them in terms a little more reasonable

First, some raw data:
    $16.2 Trillion in total national debt (source: usdebtclock)
    $3.54 Trillion in spending in 2012  (source: wikipedia)
  - $2.45 Trillion in taxes raised in 2012
    $1.09 Trillion further in debt this year.

I decided to compare these proportionally to the "average family" and so I compared the tax income of $2.45 Trillion to the US Median income of $44,389 (source: wikipedia) to determine some things:

If the United States government as a whole was a median family living in the United States:
   Annual Income:   $44,389
   Annual Expense:  $64,137
   Family Debt:        $293,510
The median family should set its budget on $3700 a month, and if the United States was a median family, it is currently spending $5345 a month. That would like overspending $1645 per month. Or overspending $55 a day. Or like the median American buying star bucks every day. For you and 15 of your friends.

Put another way, imagine you are a median household that's got a balanced monthly budget. Then you decided to buy a $70,000 new car at 7% interest with a 48 month loan, you would have to pay $1676 a month.

Let's look at how much it pays per month:  It would pay:
   ~$1070 a month in social security
   ~$1015 a month in defense
   ~$1015 a month in medicare and medicaid
   ~$320 a month in interest
Even DRASTIC thoughts like cutting all social security, all our defense, or all medicare spending won't help us even balance our monthly budget, let alone work to pay down our debt.

Wednesday, November 14, 2012

Chutes and Ladders (or Tangents and Cotangents)

Chutes and Ladders - a game for ages 4 and up
Tangents and Cotangents - a game for ages 16 and up
Last week I was playing Chutes and Ladders with my daughter (well, I was playing and she was arguing with me about why I kept moving my piece three spaces forward and didn't just put it on a space that had a three in the number, like 3, 13, 23, etc like she must have thought were the rules) and I made the amazingly smart observation that there were six spaces in the spinner, and there were six basic trig functions. Before long I had gotten board and wanted to find ways to add strategy to the game, and found that at times it was more beneficial to go backwards several spaces instead of forward, if by doing so I could avoid a chute or land on a ladder.

It wasn't long before I had decided upon a few rules, and come up with a game we could play in precalculus, which I decided to call "Tangents and Cotangents".  I thought the name was a nerdy way of describing Chutes and ladders, because the graph of cotangents is always decreasing like chutes, and the graphs of tangents are always increasing like ladders.

I brought the game to school, and described the following rules to the students:

  • Students (in teams) would answer estimation questions like sin(25) or tan(258).  (NO CALCULATORS ALLOWED!) Each trig function was worth a different amount of points. If the students estimated within 10% of the correct value, they moved forward that many spaces. If not, the other teams would be able to steal the points if they had estimated correctly -- so everyone was interested in every question. The points were defined as follows:
    • sine = 1pt
    • cosine = 2pt
    • tangent = 3pt
    • secant = 4pt
    • cotangent = 5pt
    • cosecant = 6pt
  • If the team guessed the value within 10%, but had the opposite sign, they went backwards that many spaces. While this might seem like an annoying penalty, eventually one of the teams caught on that it could be used their advantage to land on the coveted 28 square, and it wasn't long before teams were "purposely" getting the sign wrong to their advantage. I didn't mind, because it made them think about and practice the signs of the values too -- part of my objective for the day.
  • Once per game, I allowed the teams to choose what point value they wanted to play for -- typically they were chosen at random like normally in the game. This added an element of strategy for the students who would wait to the opportune time to try to hit a big ladder. I think I would change this rule next time to reward REALLY close guesses (say, within 1%) with an additional free choice.  
  • Occasionally we would play a question that was available for all four teams. Any team that guessed within range was awarded the points (forward or backwards as necessary)
In order to help facilitate the random choosing of the game, I created an excel file that gave me a random trig estimation question every time I pressed F9, and then displayed the answer and the acceptable range of values when I pressed F9 again. When students chose a particular point value, I had to press F9 repeatedly until the appropriate value came up -- for instance, when one group wanted a 4 point question in order to land on space 80 for the win, I had to press F9 over and over again until a secant question came up. You may download this excel file here, and you can read about the underlying workings of it at my post here.  For more on estimating trig functions, I suggest you read on the unit circle definitions of trig functions.

Monday, November 12, 2012

Unit Circle Trig Functions


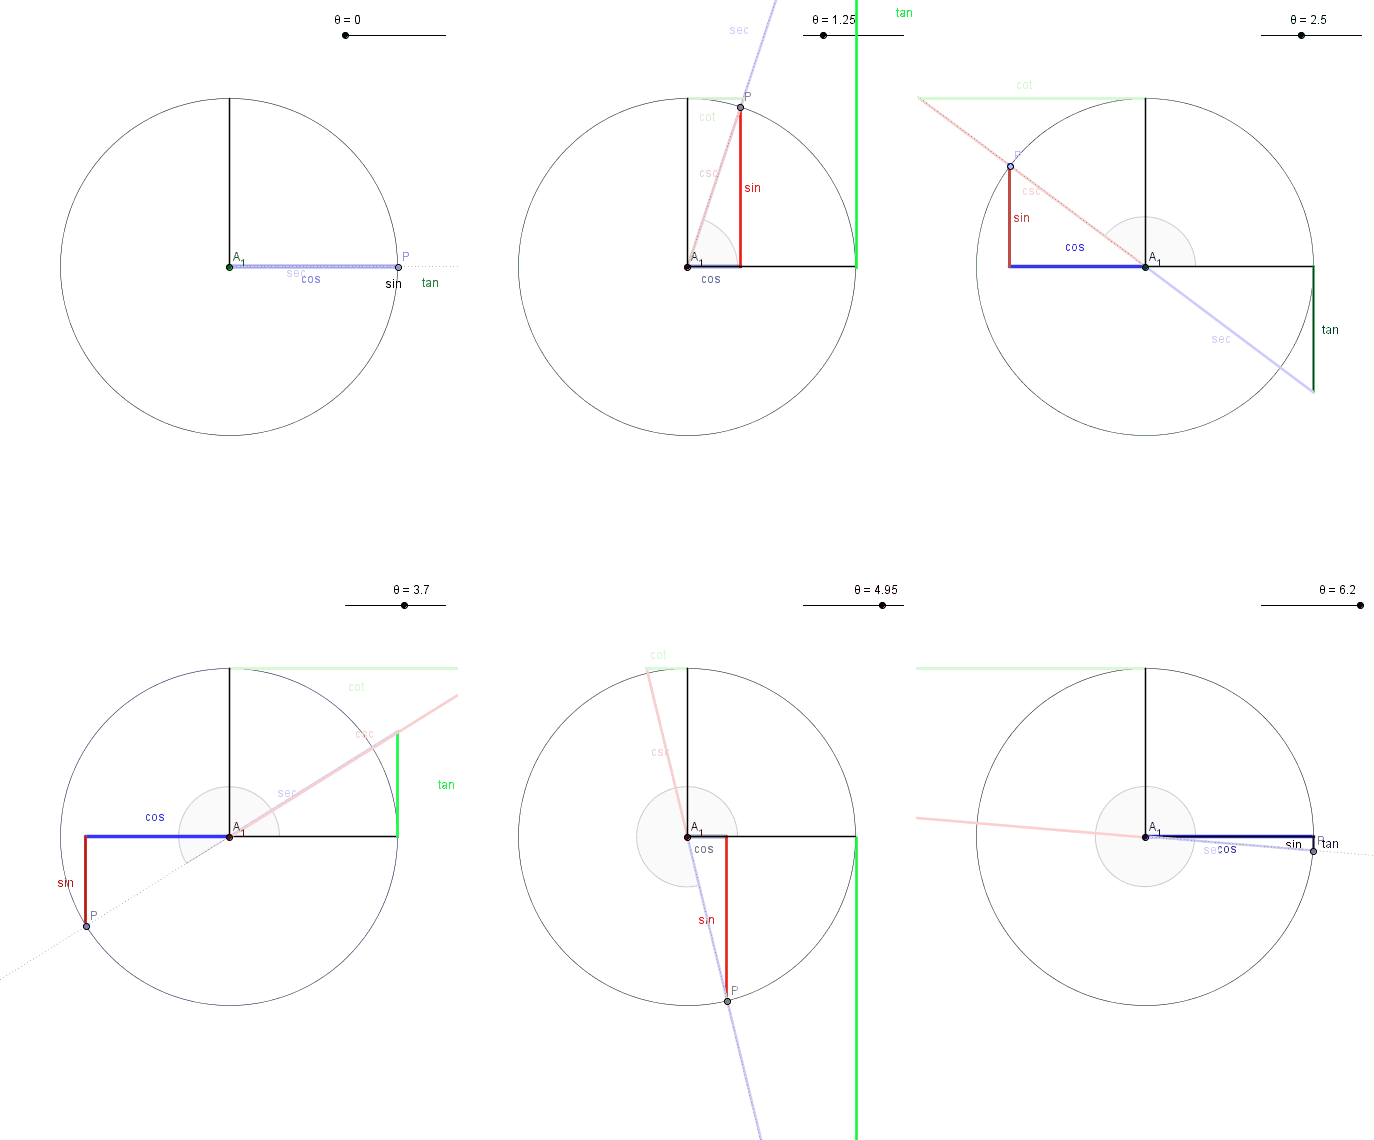
I have been teaching my precalculus students how the trig functions can be defined by using the unit circle. Below is an animated .gif file that shows how each of the six trig functions can be defined using the unit circle:
    The Six Trig Functions on the Unit CircleCreated with Geogebra
    Downloadable image: (952 KB)
    Downloadable Geogebra file: (5 KB)
The angle in the animation ranges from 0 to 6.28 radians, which is 0 to 360 degrees. The circle is a unit circle, which means it has a radius of one. It is centered at (0,0) and the angles are measured in the typical counter-clockwise direction.  Each of the segments is then defined according to the following rules:
  • Sine: The height of P, which is the where the angle intersects the unit circle. Sine ranges from -1 to 1, depending on whether P is below or above the x-axis.  
  • Cosine: The x-coordinate of P, which again ranges from -1 to 1 depending on whether P is to the right or left of the y-axis.
  • Tangent: if you extend the angle out until it means the line x=1, then the tangent will be the segment extending "tangent" to the circle from (1,0) to that intersection. If the angle is in quadrant II or IV, the intersection point is below the x-axis, and so tangent is negative. If the angle is in quadrant II or III, the angle wouldn't intersect the tangent line, unless you extend it backward. Notice it ranges through all values from -inf to +inf, and twice is undefined at 90 degrees and 270 degrees because at those points  the angle never intersects the line x=1 because they are parallel.
  • Secant: if you extend the angle out until it meets the line x=1, then the secant will be the segment cutting through the circle, extending from (0,0) to that intersection. For quadrants II and III, the angle would have to be extended in the opposite direction, which is why secants have negative values there. Secant values are always greater than 1 (or less than -1) because they have to get through the unit circle and out to the line, and the smallest they can ever be is when they at angles 0 and 180 degrees. Like the tangent, secant is undefined for 90 and 270 degrees because the angle is parallel to the line x=1
  • Cotangent: like the tangent, only everything is measured from the complement of 0, or 90 degrees. Extend the line outward until it meets the line tangent to the circle at 90 degrees, or y=1.  If this intersection is on the positive side of the x-axis, cotangent is positive, and negative if on the other side.  
  • Cosecant: like the secant, only the length of the segment extending out to the line y=1. It can have negative values, when the angle is in quadrants III and IV because the angle would have to be extended backward instead
While it takes a day or two of practice for the students to get used to the definitions of the segments, I have found them to be especially useful.  I use these definitions to help estimate trig values, to determine their signs, to develop the idea of graphs of trig functions, and even to prove some identities.  The Pythagorean identities are especially nice to demonstrate here. I always remember 1+tan(x)^2 = sec(x)^2 because they are connected in their definitions, and adding the segment (0,0) to (0,1) creates a 90 degree triangle to which the Pythagorean theorem can be applied.

Using Excel to Make X-Y Grids for Graphing

I've seen a lot of bad looking xy grids in my days, looking at other teachers worksheets and tests, and I wanted to show what I use and make it available. I create a scatter plot in Excel, hide the points that created it, and change the window by adjusting the x and y axis. Over the years, I have refined the look, and created a huge bank of different sized graphs, similar to the one below:
Sample Graph, created in Excel
Downloadable Excel File 
Anytime I need a graph for a worksheet, quiz, or test, I open up this file.  (I do that easily by having it pinned on the start menu). I see twenty or so graphs immediately available, and if any one of those works, I'll just copy and paste it into the quiz. If I don't see one that I like, I'll make a copy of one of them and paste it into excel (this way my library of graphs always grows) and I'll change the x-axis and y-axis to fit what I might need.  To do this, right click on the x-axis, or y-axis, and go to "Format Axis" near the bottom.  The following window will come up, where you'll want to make some changes:
The adjustments in red are my most common changes -- this window is what comes up when I clicked on the y-axis in my sample graph above.  By adjusting the maximum or minimum values (in the red circle) the graph can display more or less along the y-axis. In my graphs, the major unit is how often the numbers on the side will appear, and the minor unit is how often the dashed lines appear.

Adjusting the axis labels to appear on the low side (see orange circle) is a nice touch, which is why the numbers don't occur on the y-axis directly, but off to the side.  This keeps them out of the way, and a little neater in my opinion.

The line style page (see yellow circle) is how you can adjust how the axis itself appears. I decided to make it stand out against all the other lines by making it a little thicker. If you right click on the dotted lines (called major gridlines) you can also adjust their look.  I find that making them dashed and thinner makes them useful, but not overwhelming when printed.

I typically copy and paste these graphs directly into Word, but sometimes I want them to be pasted as pictures, instead of as editable graphs, embedded in the word file. To do this, instead of pasting in the usual way, Paste Special (I do this by pressing Alt E, S because I memorized that keyboard shortcut from older versions of Word) and then choose to paste it as a picture.

Saturday, November 10, 2012

Quick Random Review Questions with Excel

One of my current uses of Microsoft Excel in the classroom is to quickly provide review questions for my students. I've used it in my Algebra classes to practice multiplications quickly by playing Around The World.
Around the World - Multiplication
   
Download this Example
In order to set this file up, I used just one function - the randbetween() function. In B1 I entered the formula "=randbetween(1, 12)" which gives you an integer ("nice number") between 1 and 12.  I entered the same thing in D1 and now Excel gives me a random multiplication problem for the students to figure out.  The key is every time you press F9, it gives you another random problem.  This is because F9 "recalculates" each cell, which in this file effectively re-rolls the dice.

Of course it's customizable by altering the numbers in the function. Sometimes I'll challenge them and go up above 12. Or I'll throw negative numbers into the mix. Of if too many "easy" ones have been coming up, I'll make at least one of them range from 6 to 12 instead of 1 to 12. The possibilities are nearly endless.

A more advanced function, coupled with this idea, can make this tool all the more interesting.  Suppose you'd like to throw up different kinds of questions -- additions, subtractions, multiplications and/or divisions? If you'd like excel to choose one of them at random, you can use the choose function:
   = choose( #,   "+",    "-",    "x",    "/")
This function will either give you a +, -, x, or / sign, depending on what # is.  If you type a specific number, say 3, then it will always give you the third choice, in this case "x".  If you instead type "randbetween(1,4)" in place of x, then it will randomly pick a number between 1 and 4, which will determine which operation to use. This effectively chooses a random operation of the four.  All together it would look like this:
   = choose(randbetween(1,4),  "+",  "-",  "x",  "/")
The "" symbols around each of those operations are required, or excel will get confused and give you an error.

I typically don't display the answers, because I can calculate them as fast (or faster!) than the students and know if they are right or wrong, but if you wanted you could create a formula that calculates them for you.  If you have the same operation all the time, this is easy -- just type "=b1*d1" somewhere.  It is a little trickier if you have excel randomly choosing operations, and requires a slight tweak of the choose function above.
  1. In a1, type "=randbetween(1,4)"
  2. Change the choose function to read: "=choose(A1, "+", "-", "x", "/")
  3. In a box where you want the answer displayed, type "=choose(A1, b1+d1, b1-d1, b1*b2, b1/b2)"

This is required because if you don't have a common cell (a1) to refer to when choosing the operation, you might have Excel choose to display a + sign, but display the answer to a subtraction problem, because a different random number was chosen in each cell. In this example, with four operations, it would be inconsistent 75% of the time, but by referring to A1, both the question and answer will always be the same.

By the way, if you want to stack the deck towards certain operations, you can have a choose function that looks like this:
      = choose(randbetween(1,8) , "+", "+", "-", "-", "*", "*", "*", "*")
which would give you twice as many multiplication problems then adding or subtracting.

Also, I don't actually have them practice division problems like this because most of the time they would be decimals or fractions. If you want them to have divisible problems all the time, alter this template to show the answer to the multiplication problem.  Then show the answer and only one of the factors. Hide the other by making the column super thin, or making the font color white. This will guarantee that the divisions are always nice.

If you have this file available as a shortcut on your desktop, it is super quick to put up at the end of class if you have a few minutes available before the bell.
Related Posts Plugin for WordPress, Blogger...