Pages

Saturday, January 19, 2013

Greek Letter Shortcuts in Microsoft Word

When typing up notes, worksheets, and assignments, I often find myself needing to type some special mathematical symbols, such as π. Other Greek letters are useful too, such as Δ for change in. The lazy thing to do is just type pi, or delta, but there are a handful of ways to insert these symbols into a document.

Character Map

  • In Windows, you can find the old Character Map -- a program I've seen since I used Windows 3.1 growing up. You can find it by pressing the Windows button and searching for character map -- and then the window on the right will pop up. In it you can find a wealth of characters that you can copy onto the clipboard and paste into whatever program you're typing in. I used it to type the π and Δ symbols above.  Though this technique can work, and work for multiple programs, I don't use it often

  • In Microsoft Word and PowerPoint, you can find Insert Symbol in the ribbon along the top. Like Character Map, it gives you a list of hundreds of different symbols that you can search through to use. The window looks like this:


  • If you notice the bottom of the box there is a shortcut key programmed in for the letter π. In Microsoft Word, you can use this code to enter in a π symbol without using this window -- much faster!  To use the code, type 03c0 (those are zeroes) and then hold Alt and press X.  You'll see that the 03c0 becomes a π symbol! Magic! And many other characters have a character code similar to π. My problem is that there is no way that I'll remember each of those strange character codes every two weeks or so that I need them. So I would have to look them up online and in the time it takes to do that, I could have just found it in the insert symbol box.
  • A related technique is to use an Alt code.  Hold Alt and press 227 on number pad, then let go of Alt and you'll see a π symbol appear.  Many other letters have a Alt code, but again -- how am I supposed to remember which codes are which?  And why in the world is the Alt code for π 227 and not something reasonable like 314?!
  • My favorite solution to this in Microsoft Word is to use the shortcut button to create my own keyboard shortcuts for each of the symbols I use often!  If you click on the button "Shortcut Key" it will bring up the following form:
    As you can see, I have created a keyboard shortcut that I'll remember, and stored it in Word so that when I return a few weeks later, I can find the π symbol more quickly!  For me, it made sense to type Alt G, P.  My line of reasoning is that it's a greek letter, Pi.  I have gone ahead and assigned shortcuts similar to this for all the Greek letters that I use on a regular basis:
    • Alt G, D for lowercase delta
    • Alt G, Shift-D for uppercase delta (for "Change in")
    • Alt G, A for alpha (for angles)
    • Alt G, B for beta (for angles)
    • Alt G, Q for Theta (for angles)
    • Alt G, T for Tau (torque in Physics)
    • Alt G, r for Rho (density in Physics)
    • Alt G, W for Omega (rotational velocity in Physics)
    • Alt G Shift-W for captial Omega (Ohm symbol for resistance in Physics)
    • Alt M, . for the mathematical symbol for multiplication
    • Alt M, 2 for the squared symbol
    • Alt M, 3 for the cubed symbol
    • Alt M, R for the square root symbol 
  • While on the topic, I should also mention auto-correct as an option. I remember using that quite frequently during my Spanish classes.  I made it so typing n~ and a' and such created the accents and symbols -- though if I used those characters much now I would probably create a series of Alt codes for them, perhaps with Alt S, N and Alt S, A, etc. 

Saturday, January 12, 2013

Reflections on J-Term 2013

We just finished J-Term and I have so much to write about, but so little time to write, so let me just do quick summaries and if I have any time (this summer?) I'll come back and elaborate.

For those of you who don't know, at our school J-Term is a week-long opportunity for our students to take some unique classes and learn things their teachers don't normally get to do during the school year. For instance, many students took iPad video making, or an interesting Hunger Games exploration, knitting, chess class, etc. The teachers suggest offerings and the students sign up for three different classes they'd like to take.

This year I offered two classes: Astronomy (which I have taught before) and a new class which I called "Did You Get My Email?" but might more formally be called Digital Communications.

Star and Planet Locator
by Edmund Scientific
In Astronomy we learned a 15-20 constellations, discussed how to use a Planisphere, the idea of altitude and azimuth, how to find the planets along the ecliptic, and how the sun moves through different constellations (the zodiac) throughout the year. Next on the list would have been declination and right ascension, but we ran out of time.

The Star and Planet Locator made by Edmund Scientific is an great tool for teaching these concepts -- and at only $3.95 per unit it's one of the cheapest I could find.  I bought mine a few years ago and kind of remember a 25 for $50 deal so if you're interested in a classroom set, look around.

These worksheets I offered:
The other class I taught was new to me -- Digital Communications. I'll admit I'm not proud of how this class turned out because I didn't put the time into it over Christmas break that I should have. In this class we learned about a ton of different technologies, leaning quite heavily on "How Stuff Works" descriptions of: the telegram, telephone, television, computers, hard drive, cd player, text messaging, email, radio, etc. We also studied binary numbers, and spent some time describing how computers convert all information into numbers, which are all converted into binary, which can mean everything can be stored ultimately as a handful of 1's and 0's somewhere.

I also did some hands on materials, though I had ambitions of doing way more. We played around with simple circuits, hooking up batteries and lights. We made a few electromagnets, and I showed them a homemade "byte" -- 8 bits -- which I made with just a piece of wood, 8 nails, and a about 40 ft of wire. I never used it in anyway besides holding it up occasionally when we discussed that 8-bits define a character in Ascii, or that three of these 8-bits define a color of an individual pixel in a picture, and so on.

I learned from this that I enjoy doing things hands-on and should take more time to make that happen in my classroom. I learned that radio shack has a lot of small circuit components for sale, such as LED's, solar panels, resistors, switches, etc and I have a lot of material now that I'll be able to use in our electricity unit in physics.  And I learned that classes will survive, even if you are fully prepped for them. Maybe that wasn't the lesson I should have learned -- but I did.

Monday, January 7, 2013

Keyboard Shortcuts

While teaching some women at church how to do things in PowerPoint, I realized there are a lot of keyboard shortcuts that I use on a daily basis and take for granted. This post is just my attempt to list them all in one place. There are way more than this, and other websites may have a more complete list, but these are the ones that I use on a daily/weekly basis.

If a sibling of mine wants to do a similar thing for Mac's, I would link to it here, or eventually when I have to learn a mac, I'll write a Mac for Windows Users guide.

Windows:
   Alt-Tab - switches from program to program quickly
   Ctrl-Tab - in programs with "tabs" like internet browsers it switches tabs
   Win-Up - Makes a program maximized
   Win-Left - Makes a program take up just the left half of the screen
   Win-Right - Makes a program take up just the right half of the screen
   Win-D - Minimizes everything so you just see your desktop
   Win-Tab - Cycles through your programs like Alt-Tab, but differently
   Ctrl-MouseWheel - Zooms in or out
   PrintScreen - Takes a screen shot of the screen and stores it on the clipboard
   Alt-F4 (don't do this one now!) closes your current program
   Ctrl-F  - Finds a word or phrase on a page

   Shift-Arrows - Selects words, text, cells, slides, etc.
   Shift-Click - Selects everything from your last click till now.
   Ctrl-Click - Adds whatever you clicked to the selection
   Right-Click - Brings up a list of different options
   Right-Click and Drag - Brings up a list of options for dragging, usually move, copy, or Create-Shortcut


Microsoft Word, Excel, Powerpoint, and many other programs:
  Ctrl-X - cut
  Ctrl-C - Copy
  Ctrl-V - Paste (yes, v is paste because P is print)
  Ctrl-S - Save
  Ctrl-A - Selects (all) everything on a page or file
  Ctrl-Z - Undo!! Gets rid of the last thing you did -- like making a mistake
  Ctrl-R - Right aligns things
  Ctrl-E - Center aligns things
  Ctrl-L - Left Aligns things
  Ctrl-B - Bolds
  Ctrl-I - Italicize
  Ctrl-U - Underlines
  Ctrl-K - Makes something a hyperlink

Excel
  F9 - Recalculates all cells - useful if you have random digits in some cells

Powerpoint:
   F5 - Starts running the powerpoint
   Ctrl-F5 - Starts running the powerpoint from the current slide
   B - puts a blank slide up while running powerpoint
   Ctrl-M - creates a new slide

Saturday, January 5, 2013

Magnitude of Stars

I remember one of the hardest things for me to understand when I first began studying astronomy was grasping the "magnitude" of stars. Magnitude -- or more properly -- apparent magnitude is a number that describes how bright a star or object in the sky appears. 

Star Magnitude Scale
Image by Astroplot
On printed star maps, you can't really show brightness very well, and so larger and smaller dots are made to try to trick your eye into seeing different magnitudes. Typically, a scale is provided like what is shown tot he right which you can use to identify the brightness of a star.

Star Magnitude Chart
Image by Royal Astronomical
Society of Canada
When astronomers first began describing the brightness of stars, they grouped all stars into six classes. The brightest stars were called first order stars, and the faintest visible stars were sixth order stars. Thus began the magnitude scale, a quite subjective process but useful none the less. Many of the stars that were first classified as 1's still have a magnitude of around 1 today, and the faintest visible stars are still given a magnitude of about 5 or 6 today.

As telescopes and binoculars were invented and turned to the skys, we realized that there were whole classes of stars we couldn't see. All of a sudden there were 7th order, and 8th order, and so on.  Now, with binoculars on a clear night, you might be able to see stars up to magnitude 9.  With a telescope and a clear night, perhaps even 10, 11 or 12. The earth's biggest telescopes can see stars of magnitude 22 (with a 24" lens) or magnitude 27 (with an 8m lens). And ones you are out of earth's atmosphere, the hubble space telescope can see magnitude 32.

Of course, all these numbers are pretty meaningless without some more precise way of defining them. As we developed ways of measuring how much light is visible instead of just eyeballing it, we could reclassify stars more exactly.  The earliest astromomer's estimated that 1st order stars were twice as bright as 2nd, and so on. Remarkably, without any tools to really measure light intake, they were pretty close. Turns out, to maintain the classifications of the early astronomers, a factor of about 2.5 is required instead. Though the whole system could have been scrapped and redone, astronomers chose a system that tries to mimic the original by using a logarithmic formula.

First, an arbitrary star had to be chosen to be a starting point for the scale. Astronomers chose the bright star Vega. This was set to be 0, and all other stars were compared in brightness relative to Vega. If Vega was 2.5 times brighter, that star was rated 1, and there are roughly a dozen that have magnitudes near one, which corresponded fairly consistently with the earliest classification of 1st order stars.

Stars that were 2.5^2 or around 6 times fainter than Vega were classified as 2's. There are roughly 50 stars with a magnitude of around 2.

The 175 or so stars that were 2.5^3 or 15 times fainter than Vega were classified as 3's.

The 500 or so stars that were fourth magnitude are 2.5^4 or roughly 1/50th the brightness of Vega.

All stars apparent magnitude's then can be classified by:
b is the brightness of a star -- which is more sophisticated than I can explain or even fully comprehend myself. But the ratio bx / bvega is what's of importance for classification purposes.

Not all stars fit exactly into a classification, but with this new scaling system, one could define a stars brightness precisely in between magnitudes, and so stars could now be given magnitudes of 1.3, or 4.2. You can always compare a stars brightness to Vega by using the factor of 2.5^m.  For instance, the North Star has a magnitude of 1.98, and so Vega is 2.5^1.98 or about 6.1 times brighter.

There are some stars that are brighter than Vega -- for instance, the brightest star Sirius is 3.6 times brighter than Vega. To determine its magnitude then find -2.5 log (3.6) which is -1.4, and so there are some stars that  have negative magnitudes. In fact, some planets such as Venus can get even brighter and have a lower magnitude. Turned to the moon, the magnitude can get as low as -12.74, which means it is 2.5^-12.74 times fainter, or 2.5^12.74 times brighter than Vega. And shining more than 40 billion times brighter than Vega, our sun during the day chimes in at -2.5 log (40billion) =  -26.

To finish, here's a map of the Big and Little Dippers, to help you become a little more familiar with some of the numbers involved. Try to identify for yourself which stars are the brightest and faintest, and compare them with the numbers listed below.
Magnitude of stars in Ursa Major and Ursa Minor
Image by AstroBob

Friday, January 4, 2013

The Constellation Canis Major and Minor

This post is the one of a series on constellations and posted throughout the year as each constellation comes into prominence.
I came across this article on New Years Eve which inspired me to write a post about the star Sirius, and its constellation.

Canis Major and Canis Minor are two constellations near the famous Orion, and are worth knowing because they house two of the brightest stars in our sky.  Canis means Dog, and so these constellations are the Big Dog and the Little Dog. I see a bad stick figure and a pair of dots myself, but I suppose with a little imagination, it wouldn't be too much of a stretch to see them as Orion's hunting dog's, following him into the woods perhaps.

These constellations are only just starting to come out in the evening hours during winter -- so unless you're out relatively late, you might not see them. The inspiring article described Canis Major as reaching it's highest point in the sky at mid-night on New Years Eve, which means if you went out at a more "normal" star-watching time at least for parents such as myself -- say 7 or 8 pm -- it won't be up yet.
Fall Mornings
Winter Nights
Spring Evenings
The dog constellations serve to tell me about our progress through the school year.  At the beginning of the year, and through first semester, I tend to see them on my drive in in the mornings. As the year progresses through winter I won't see them as often, as they'll be out in the middle of the night. As the year reaches the end, these dogs are out and observable during family-friendly observing times of just before bedtime during the spring months -- March April or May.

Canis Major is a southern hemisphere constellation -- one that is approximately 20° below the celestial equator. At my latitude, that means it is not out for too long each day -- only about 8-9 hours a day. Canis Minor on the other hand is just barely a northern hemisphere constellation - approximately 5° above the celestial equator. That means we can see Canis Minor longer each day -- about 12-13 hours a day.

One of the reasons for observing the Dog's is because of the bright stars they contain. Sirius is the brightest star seen anywhere from earth, short of the sun. It's the bright one in Canis Major -- or the head of the stick figure in my  minds workings. Procyon in Canis Minor is another bright star - 6th brightest in the sky for Northern observers. I often confuse the pair of stars in Canis Minor with the pair in Gemini, as they are about the same width in the sky. You should be able to tell the difference two ways. First, in Gemini they are both bright stars, where as Procyon far outshines its partner in Canis Minor.  Second, Gemini is to the right of Orion and Canis Minor is above and to the left.

Many people describe these two bright stars, and the red giant Betelguese as forming a great Winter Triangle in the sky. While I could draw this triangle in the sky -- it doesn't really pop out at me.

Winter Triangle

Another feature of Canis Major, is that it contains one of the biggest known stars -- what Louie Giglio described as "The Big Dog Star" in one of my favorite sermons of all time: How Great is Our God. At this link you may begin watching the portion where he describes The Big Dog Star. In it he compares a series of increasingly large stars with the earth as the size of a golf ball. On that scale, VY Canis Majoris would be the size of Mount Everest. Somewhere in Canis Major is a star too faint for you to see that is larger than the orbit of Jupiter around our sun. Put another way, if this star was where our sun was, we would be IN it -- not looking at it, and so would Mars and so would Jupiter. 

Thursday, January 3, 2013

Exponential Growth in Settlers of Catan

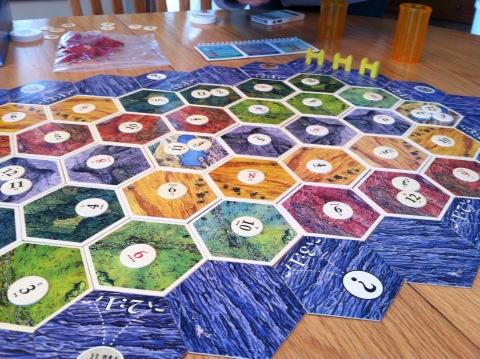
Our family loves playing Settler's of Catan. Settler's is board game where you must collect resources (wood, wheat, ore, sheep, and brick) in order to build different things (settlements, roads, cities, knights, ships, etc). The resources you collect each turn depends on how much you have built, and where you have built, and the roll of a dice. If you have built next to certain numbered tiles, then you collect those resources when that number is rolled. As you expand, you touch more numbered tiles and collect greater resources.

Mathematically, this means that the number of resources you collect as the game progresses follows an exponential curve, shown to the below.  This is a very common curve for growth, and is especially common in places where how much you grow depends on how much you have.  Other common places of exponential growth is financial (interest on money grows depending on how much you have invested) and populations (the more people or animals there are, the more they are making babies).

This exponential nature of the game suggests a very important strategy -- which I like to think of as "steepen the curve". The most important thing that you can do in the game is to increase your chances at collecting resources. Every time you do this, you increase the number of resources you're likely to obtain until your next turn, making your next turn even more powerful than your last. Even though there may be quicker ways to earn points, like making a longer road for instance, do whatever it takes to get another settlement, or another city.

Setting up the game, you start off with a settlement and a city, which allows you to touch or collect resources from up to six different numbered hexes. To begin, you need to build a road and a settlement faster than anyone else. This requires two wood, two brick, a wheat and a sheep. If you can collect these before any of your opponents, you have significantly increased your odds of winning. While I have not been nerdy enough to record these statistics during all the games I've played, I feel confident saying that more than half the times I've played and managed to build the first settlement, I've won.

To illustrate why, let me show a graph. On the x axis is the number of turns in a game, and on the y-axis I have graphed "Resource Cards Obtained". To begin, your six (or so) tiles probably have a collective rate of return of somewhere around 2/3 of a card per roll of the dice (more about this in a different post).  Starting out with 3 cards, this puts you and your opponents on the line y = 2/3x + 3.  This suggests it would take you about 6 dice rolls before you'll have enough cards (actually 7, one more than enough) to buy a settlement. That is point A on the graph. If you are able to buy a new settlement, this ought to increase your chances at collecting resources -- perhaps to around an average of 1 card per roll now. This is indicated by the steeper line in the graph. Now you'll gain more resources, and reach the next pivotal point faster than your opponents.

The next chance you have to steepen your curve, do it. This will require either building another city (two wheat and three ore) or a settlement (two wood, two brick, a wheat and a sheep).  Either way, on average it will take another six rolls to obtain this.  I'll take a moment to illustrate the strategy of building a settlement/city as soon as I can. My assumption is that on average each new settlement will increase the slope of my resource gaining line by 1/3 of a card per dice roll. On average it will take 5 to 6 cards (granted, they have to be the right cards, but that's what trading is for) to earn a chance to build. Within 6 more rolls I can probably build again, and then it only takes about 4 to build again, and then only about 3.  With each successive build, the number of rolls before I can build again goes down on average. This produces the steepening set of lines drawn to the right. Taken as a whole, this looks very similar to the exponential curve shown earlier -- even though it's a series of lines.

Why is this strategy so important?  Let me illustrate with a simple choice, early on in the game. There is a rule that says you must build your first settlement two roads away. Suppose instead you decide to take time to build three roads away -- figuring it will help you to branch out a little first. This will likely take an additional 3 rolls at the beginning of the game, because you only average 2 cards per 3 rolls early on. This seemingly insignificant choice actually puts you significantly behind.  If you now change strategies and try to build as aggressively as your opponent did from the get-go, you'll find yourself just falling further and further behind. In this final graph - the red curve shows aggressive building from the beginning and the black curve growth delayed by just one choice - waiting to build a settlement after an extra road. Notice how the two curves are getting further and further spread out as the game progresses.


Now I'll admit this is a simplified graph - and there are times where building farther away might be advantageous. For example, maybe building in one location over another allows you to create a much steeper rate of return than another location -- but in the grand scheme of things, it would have to be perhaps twice as good to make up for the extra turn it takes to build there.  If it only causes you to touch a 6 instead of 5 -- it's probably not going to catch up with someone who has already built and started walking along the red curve.

It also suggests making efforts to obtain the important cards that cause you to build quickly. Wood and bricks (to make roads and settlements) are crucial at the beginning -- the others can be obtained in time, which you'll have if you are able to build a settlement first and always be on a steeper curve than your opponents.

Wednesday, January 2, 2013

Expected Value and Settlers of Catan

Settlers of Catan is a board game my family likes to play, where you obtain resource cards based on the roll of the dice, and what terrain hexes you have built settlements and cities next to. The board, shown below
shows how each hex is assigned a different number.

Suppose in the course of the game you have obtained a settlement on the corner of a 6, 9, 10 spot. How does that compare to say, a city (which collects double) on a 2, 3, 6 spot?  

Dice Rolling Combinations:
Image by BestCase
Because you are rolling two dice, certain numbers are more likely to come up than others. For instance, 7's are more likely than 10's because there are more ways that you can roll a 7 than rolling a 10. In the image to the right, you can see that there are six ways to get a 7 but only 3 ways to get a 10. Over the course of time, more sevens will usually come up than 10's.  Settler's does a nice job of helping you see this by placing dots on the number tiles. Each dot represents the number of ways of obtaining that number.  For instance, the 6-tiles each have five dots on them because there are five ways of rolling them.

Probability, with dice and cards for instance, is calculated by dividing the number of ways of obtaining a desired outcome by total number of ways possible. So for rolling a 10, the probability is 3 out of 36, or about 9 percent. 

Expected value is useful when different outcomes have different payouts. For instance, in the course of the game you might find yourself receiving five different cards every time a 4 is rolled, or three different cards whenever a 8 is rolled. 8's are rolled more often, but 4's receive more when they are rolled. We would say both of these have the same expected value. Expected value is calculated by multiplying the probability of an outcome by its payout. Rolling a 4 has a probability of 3/36 * 5 cards is an expected value of 15/36.  Rolling an 8 has a probability of 5/36 * 3 cards gives an expected value of 15/36. 

At the start of the game, I had a settlement on a 6, 9, and 10, and I had a city on 2, 3, and 6. Settlements receive one card each, and cities two.  So to begin, I would calculate my expected value as:
   6:  5/36 * 1 = 5
   9:  4/36 * 1 = 4
  10: 3/36 * 1 = 3
   2:  1/36 * 2 = 2
   3:  2/36 * 2 = 4
   6:  5/36 * 2 = 10 
Total: 27/36

This suggests if I rolled the dice 36 times, I should expect 27 cards when all is done. Reduced, this suggests I  will earn cards at an average rate of 3/4 of a card per roll of the dice. Some days I'll gain more than that but others I'll gain nothing.  

As the game progresses, I'll have more settlements and cities, and my expected number of cards each roll of the dice should increase. Tomorrow's post will expand on this, and show the importance of increasing this expected value as quickly as possible.

Tuesday, January 1, 2013

New Years Baby

My father in law is a New Years baby.  In fact -- he is THE new years baby for his hometown -- the first child born in 19591955. I think he has a bronze-plated baby bootie to commemorate the occasion.

I was wondering, as I always do, "What are the chances?"

Unfortunately, this question is hard to answer because it is kind of vague, so I'll try to tackle some of the different directions this question could be answered.

Popularity of Birthdays: Darker squares
are more popular birthdays than lighter
Image by The Daily Viz
First, what are the chances of having a baby born on New Years?  Assuming all days are created equally, it would seem that being born on New Years would be a 1/365 chance. However, all days are not created equally. Some days are notoriously popular for delivering babies, and others particularily avoided. Christmas for instance, has very few babies born on it, but the days just prior and just after have a slightly higher likelihood. New Years is another one of those days. Of course, many pregnancies are planned and the most popular times to have children is July Aug and September, with January being one of the leas popular months to have children. This is illustrated beautifully in the info-graphic to the right.

Assuming you want to try to have the New Years Baby -- what are your chances?  This is a sticky subject because the ability to conceive a child varies so much from couple to couple, and the likelihood of a conceived child being carried healthy to full term is no sure thing either.  A few websites (#1 and #2) suggest the chance of a healthy couple conceiving in a given month are less than 20% and the chances of that baby surviving till delivery are only around 70%. While these two percentages are certainly not independent probabilities, this puts a rough likelihood of (.20*.70) or 14% chance of being able to have a baby even remotely close to New Years on purpose.

Suppose you are able to successfully conceive and even place your order on the statistically perfect date (about Day 366-281 or day 85) what are the chances you'll deliver on New Years? This is the question all pregnant women want to know -- will I have my baby on my due date?  Very unlikely. An informal survey shows only about 5% actually deliver on their due date.  Again abusing the independence of these variables, which can certainly not be assumed, 5% of 14% is 0.7%, which is only slightly higher than 1/365 chance.

Of course, even if you are able to have a child on New Year's day -- what are the chances you'll beat all the other couples trying for the bronze booties? I suppose that depends on what town you're competing in. In my hometown of Grand Rapids -- how many babies are born on a given day? Ends up this was a very hard question to answer as I couldn't find a direct answer anywhere online. A few news articles suggest to me that there are only a handful born on a given day, and so you don't necessarily have to have perfect timing, although last years new years baby did. Another website suggested only a handful of babies were born on leap day, and only a few on 12-12-12.

I couldn't find any usable birth rate statistics anywhere for Grand Rapids Michigan, but I'm not going to let that stop me. With a current population of around 190,000 and a national annual birth rate of 13.5 per 1000
that yields approximately 190,000*13.5/1000 or 2565 births per year, or about 7 births per day. Of course, hospitals in Grand Rapids service a population larger than that, but not significantly larger -- maybe double? I remember looking in the nursery at St Mary's when both of our children were born and seeing less than 10 babies there, so I'm going to say that being the first baby born on New Years add's an additional 10% chance to things, yielding a final likelihood of 0.07% or 0.0007. This seems pretty consistent with the fact that 1 of those 2565 babies born had to be the first one born in a year, and 1/2565 is .0003. I'm sure I'm grossly simplifying things here, but it looks like if want to win those bronze booties -- than try. If you try, you'll roughly double your chances of having your baby be "the new years baby" in Grand Rapids as opposed to, say, just another baby.

And that half dozen of you friends and family members who are reading this and wondering -- no, we have no intentions of winning the bronze bootie in 2014.
Related Posts Plugin for WordPress, Blogger...