Pages

Thursday, February 28, 2013

Some Geogebra Hints

Perhaps I should have made
 a real snowman instead
of playing with fake ones

Image by Benice
During our last snow day, I spent a large amount of time (for fear of embarrassment, I will not specify how long...) playing with geogebra. Along the way I learned a handful of tricks that I wanted to write down in one place. So, without further ado, here's an assorted (not random) list of tricks for working with geogebra:
  • Right-click and drag draws a box and zooms in on that box
  • Ctrl-Click and drag grabs the screen and moves it
  • Ctrl-Alt-Delete-Shift-Right-Click and drag infects your computer with millions of geogebra viruses. Don't try it -- the rest of my snow day was spent purging my hard drive and trying to save pictures of my daughters.
  • Entering a point with a semi-colon enters it in polar coordinates
      Ex: (4; 1) puts a point at a radius of 4 and angle of 1 radian (around 57degrees)
      Ex: (4; 30°) puts a point at a radius of 4 and an angle of 30° -- you can find the degree symbol off to the right if you click on the greek letter alpha and find degrees symbol
  • Actually, you can insert a degree symbol while typing by pressing Alt o
  • You can plot a complex number by using the imaginary number i, which you'll have to type using Alt i
  • To plot a function in polar form:
    1. Define your function in f(x) notation
    2. Create a slider to act as the Theta settings (from 0, to 2*pi, by pi/100 is good)
    3. Create a curve with the command:
          curve[f(t)*cos(t), f(t)*sin(t), t, 0, theta]
      To watch someone describe this process watch this video.
  • Actually, you can insert a theta symbol by pressing Alt-t 
  • and a pi symbol while typing by pressing Alt - you guessed it - p. If only microsoft word was that easy.
  • To put a picture into Geogebra is fairly easy, but to describe exactly where it goes, right click on it and go to position tab. Then you can type in the coordinates of the corners of the picture directly, or you can attach these coordinates to sliders so that you can control them dynamically. Often I like to put the picture as a background object, so that other things lie on top of it.

Wednesday, February 27, 2013

Are you smarter than a calculator?

Lately, I have been noticing how dumb our calculators are. It's become kind of a running theme in my classes, where I've been teaching how to use different graphing tools, and I say several times a week "and remember, you have to be smarter than your calculator" or "you have to help your calculator..."

The calculator doesn't think like humans. God created us--not calculators--in his image, and I believe one aspect of that is the ability we have to reason, to notice patterns, to create, to organize, to see. These are all things that calculators, and in general computers or machines, are all pretty bad at. They are improving, because our minds are helping to generate better and better machinery, but they still don't work like humans.

Perhaps the best example of this is the Captcha messages at the bottom of so many websites. Computers and bots are still horrible at "seeing" things. Most humans can interpret those pictures and type letters or numbers properly, but that relatively simple operation is difficult for most computers. That's because we think about the problems entirely differently.

Likewise, our calculators think about calculations entirely differently than us. We can think algebraically and manipulate symbols, variables, and even numbers in symbolic ways that allows us to simplify problems, or calculate values exactly. Most calculators don't think in that way at all, but are programmed with different algorithms that work with really precise approximations and quick calculations. Even the slowest earliest calculators can do this sort of thing faster than all but the freakest of humans -- but I haven't seen any calculators that are good at playing What's the Word.

Here's a bullet list of items that I've noticed lately:
  • In PreCalc we've been studying complex numbers. One assignment the other day was to calculate i17 which is easy to calculate by recognizing a pattern.  i, i5, i9, i13, and i17 are all equal to the purely imaginary number i, but the calculator spit out -1E-13 + i.  Yes, the -1E-13 is a ridiculously small number, close to zero, but it shouldn't be there AT ALL! What strange algorithm does the calculator use to calculate that instead of just recognizing the pattern like humans?
  • Similarly, some versions of the calculator were not able to convert some of our operations involving complex numbers into exact fraction form -- where as we could. Some calculated approximations (admittedly better approximations than we could find in anything short of five/ten minutes) but several others gave an ERR: data type message instead
  • In Algebra 2, we gave been using the calculator to calculate summations, and the notation for summations is sum(seq(function,VAR,start,end)) and we have been laughing at the fact that even though our functions only have one letter in them, we still need to write that variable again. I understand you could certainly have many variables in a function and then you'd have to specify which one is the index -- but when there's only one, you'd think the calculator would be able to figure that out.
  • In Algebra 1 we've been graphing systems of equations, and numerous stupid calculator quirks have popped up. Though we set the word problems up with sensible variables like N for the number of nickels and D for the number of dimes, when we went to graph things, we had to use the letters X and Y. Again, you could maybe give your calculator the benefit of the doubt because maybe those letters are going to be used for constants (like I do in physics storing 6.67E-11 in for G) but...
  • Then we try to calculate the intersection of two lines and we have to tell it which lines we're interested in and help guide it towards the solution. Seriously?! There's only two lines on the screen! And they're lines! Not curves!  
  • If the intersection isn't on the visible window screen, the calculator won't be able to find it for you -- you need to realize that those lines will intersect above, left, right, etc. of the screen and adjust the window yourselves.
  • And what's with providing the answer as 1.999946 when it's clearly and exactly 2?  The algorithm that calculates the intersection necessarily has limits to its precision, and sometimes those fall short. My students better not ever report an answer of x=1.999946 to me.
  • To be fair, let's pick on non-TI84 calculators -- one of my newfound favorites is the app MyScript Calculator which interprets my handwriting and calculates things for me.  I'll admit, I played with it for a good 30 minutes after downloading it -- only true math nerds play with their calculators right?  But I noticed pretty quickly that it's trig values didn't always calculate properly, which was a bug that their updated version supposedly has fixed. I knew that because I knew the limits of sine and cosine values, and even had several memorized -- and also can estimate relatively well and had ideas of what the answers should be ahead of time.

Monday, February 25, 2013

The Constellation Leo

This post is the one of a series on constellations and posted throughout the year as each constellation comes into prominence.
Leo is one of my favorite constellations. It was one of the first after I fell in love with astronomy in 2008. It was the first one that I had never noticed before, but set out to find and add to my repertoire.

Leo is a lion, and one of the constellations that I feel actually looks like its supposed to:
Leo the Lion
Image by Backyard Stargazing
It reminds me of the sphinx:

What helped me to identify Leo was to find the sickle -- the curve of six or seven stars which I call the "backwards question mark".  The dot of this question mark is the brighest star in Leo, called Regulus, or Reggie for short. At #15, he is one of the brightest stars in the northern hemisphere. He lies almost exactly on the eclipitic.

Lying along the ecliptic, Leo is therefore a zodiacal constellation. This means the sun, moon, and the planets periodically pass through Leo. When I was first learning about it, in 2008, Saturn was moving around under Leo, though now it has moved on and is located in the relatively blank section of sky in Virgo and Lyra.

The sun passes through Leo from mid-August to mid-September, which makes Leo a nice constellation to look for in late winter and spring. I find it by locating the Big Dipper, and pretending it is dripping things. If it drips things down thru the cup, those drops would fall on Leo's head:
The Big Dripper and Leo

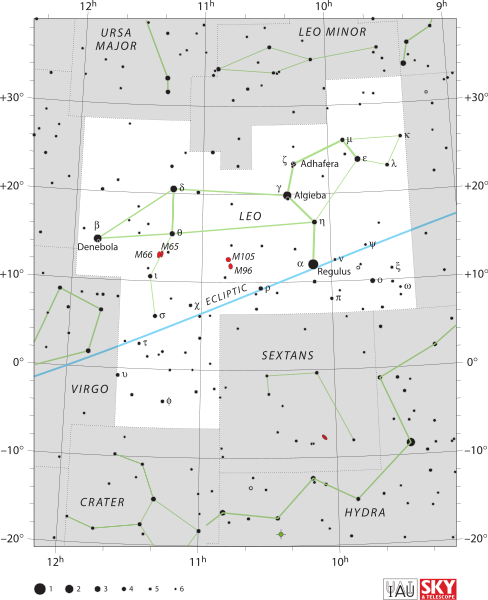
Below is a more specific map of Leo.  With a telescope, Leo houses a few good Messier objects worth looking for, but none are good sights for binoculars.
Leo
Image from Wikipedia

Monday, February 11, 2013

Polar Rose Explorer

Here is a geogebra activity I made which explores polar graphs for precalc.  Just in time for Valentines: Men, be sure to make your wives and girly-friends a dozen polar roses!

If the above embedded file does not work -- you probably need to install or update Java. You can also find it on Geogebratube.

Saturday, February 9, 2013

This is the Day

Today I had several hours on my own with the girls while Carrie ran errands, and as much as I love my girls -- I often dread these times.  Usually it's because I feel inadequate, especially with my littlest. I am not good at deciphering what she wants -- what's the difference between AAAHHH! and WAHHHH!?  Even if I can figure out what she wants -- I'm not as good at everything as Carrie, nor as quick at getting a bottle ready, and Ellie get's frustrated waiting for me.  
On top of my inadequacy, I also struggle with patience issues -- and lose my patience most often with my own children.

But enough about me -- I really just wanted to share a few thoughts I had while playing with Ellie. 

Today I sat her up, and put a toy in front of her so she could practice sitting up.  The toy was a little ball-like face that giggled whenever it shook. Ellie loved it, and giggled along with it for at least fifteen minutes. As I sat there enjoying it, I thought "Toy: this is your day. Until now, Ellie hasn't been strong enough to sit up and really enjoy you, and tomorrow she'll probably have grown up so far that you'll be boring. This is your day to  shine -- so giggle on little one.  Giggle on."  

I know -- really deep right?  But it did remind me of the popular Sunday school song:
This is the day
That the Lord has made
We will rejoice and be glad in it
It reminded me that our time is short. Our time as parents is short -- our kids are only young for so long!  Every time I ignore Ellie is precious time I can't get back. Will I miss my "day" someday? 

It also reminded me that our time on earth is short. We were made to honor and glorify God and how often I waste that time. Why? This is the day that the Lord has made! Giggle on!

Friday, February 8, 2013

Graphs of Inequalities

I just finished a unit on inequalities with my Algebra 1 students, and I remember in years past struggling to find a way to include number line graphs in my quizzes, notes, and slide shows.

 Over the years I've amassed a large number of these number line graphs, of different types, and thought I'd throw them up on the blog for the one or two other math teachers who might stumble across this and want them. They are in a PowerPoint format, because I found that working with shapes and lines in PowerPoint was easier than any other program I had.  If you're interested, here's a file containing them.

They are just a series of shape objects, which I alter by adjusting their size or orientation.  Once I have the graph I want, then I select all the objects, copy them, and paste them as a picture, which I can use in PowerPoint or Word.  
One thing I am still looking for is a good source of creating two dimensional graphs. If you know of something, post it in the comments below.

Friday, February 1, 2013

Record Breaking Game of Lightning

As I write this, people are supposed to be gathering at Cornerstone University, where I just finished my masters degree this past April and across the street from my school, to hopefully break the world record for "largest game of Knockout" ever.  They have a goal of having over 500 people come and play Knockout - or as I grew up calling it, Lightning.

All the way home this evening I was wondering if I was going to regret the opportunity to be there and to make history.  So I consoled myself by trying to figure out How long it would take to finish the game?

For those of you unfamiliar with the game, read the rules, and then come back.

One problem with this question is that there isn't a definite answer to it -- at least not until tomorrow when I read about it and find out how long it took.  The game potentially could go on forever, or could be over in ... well -- maybe we could start there?

Actually, let's begin with just a few estimates. I'm going to assume that on average it takes t=7 seconds for a person to get the ball, shoot an initial free throw, catch the rebound, shoot a layup, etc. and pass the ball to the next player.  Some will certainly take less time, and others more, but I need to use something.

I'll also estimate n=500 people showing up.

To begin, let's see how long it would take just to get through the first round -- that is for everyone to have touched the ball and had one attempt to knockout the player in front of them:

It will take one hour just to get everyone a chance to shoot the ball -- wow.  Already I feel better heading home!

Just for kicks, how big would the line be?  Assuming about 3 feet of space between players, it would be:

The line would be nearly a half mile long, or would likely weave back and forth nearly 10 times on the basketball courts. Of course, cornerstone's gymnasium is huge and has a jogging track around it too, so they've probably thought ahead about how the line will operate- I hope.

So how about an estimate for the minimum amount of time it would take to finish? The very least number of shots required would be if EVERY time two people came up to shoot, the person behind beat the person ahead of them. That produces a pattern of people:
  (loses)(wins)(loses)(wins)....
  This would eliminate a player every time -- so after 500 pairs, there would be one person left over.  This yields 1000 shots, or approximately 2 hours.  I wasn't willing to devote that much time to the activity -- (and yes -- I would have ended up being that last shooter because I am that good).

Of course, it's certainly going to take more than 1000 shots, because there will be many times when the back player doesn't win.  Suppose the back player wins 50% of the time?  Let me try to encode what I'm envisioning:
   (survives)(loses)(wins)(survives)(loses)(wins)
 This should require 1500 shots, or roughly 3 hours to complete.

If players are equally matched, the back player shouldn't win even that often though, because they have a little disadvantage because the player ahead has a head start.  Suppose they have a 33% chance of winning? It might look like:
  (survives)(survives)(loses)(wins)(survives)(survives)(loses)(wins)...  It takes four shots to produce a knockout now, so approximately 2000 shots or 4 hours to complete.

Several years ago, when I was in undergrad, four hours on a Friday night would probably be fun to spend on something like this massive basketball game -- but not so much anymore.

I have to admit, I'm a little disappointed in how this post turned out -- I was making things super complicated in the car thinking about probability and how many rolls it takes to roll a six and how many shots it takes for a 50% shooter to make one and making this problem way more complicated than it needed to be.  So I was anticipating pulling out all sorts of statistics and the binomial theorem, but oh well. Perhaps another day.
Related Posts Plugin for WordPress, Blogger...